10thquantum
Suneet
EMC: 20% – 25% upside in 1 year
Trade: Long EMC Current price: 26.75 Expected price: 33 Upside: 23% Time: 1 year
Thesis:
Cheap valuations, EMC on a stand-alone basis (stripping VMware) is significantly mispriced, huge cash pile, share buybacks,market leader, taking market share from competitors, sticky business, focus on innovation, smart acquisitions with power to scale them, strong distribution network,faster growing latest emerging storage offerings, growth in virtualization and hybrid cloud.
Company:
EMC Corporation (EMC) is the world’s largest provider of data storage systems offering products, services and solutions to assist customers with every phase in their IT infrastructure. It helps clients in managing and safely securing large quantities of increasingly complex information. It offers data storage, back up and archive, content and infrastructure management, information security, analytics, virtualization, cloud computing, and other services that enable companies to store, manage, analyze and protect data.
Every organization needs data management and hence EMC’s clients are very diverse ranging from financial institutions, social networking, media, manufacturers, healthcare, internet service providers, telecommunications operators, airlines and transportation companies, educational institutions, public-sector agencies, etc.
The company generates revenues from five segments: two being the major: information storage (69.5% of the revenues as of FY13) and VMware (VMW) virtual infrastructure (22.2% of the revenues as of FY13).
As of 31 December 2013, EMC owned 80% controlling interest in VMware (VMW) and held approximately 97% of the combined voting power of VMware’s outstanding common stock.
Problems analyzed:
1. Public cloud: Public cloud, which is growing at an exponential rate, is a threat to EMC and VMware. In public cloud, data is stored and managed by the cloud application provider. This has advantages (especially to start-ups) as the cloud application user has no initial network infrastructure and maintenance cost, all it needs is the internet connection. Public cloud service providers offer storage and computing to organizations as and when needed and how much they need it, as compared to the traditional way of buying storage and systems from EMC (or NetApp) and essentially paying for extra, unneeded capacity (at least initially) and hence they are seen as a large threat to EMC’s traditional business model. It also allows enterprises to get their applications up and running faster, with improved manageability and less maintenance, and enables IT to more rapidly adjust resources to meet fluctuating and unpredictable business demand. Simply put, public cloud reduces enterprise hardware needs which is a threat to EMC and VMware. Also, some of these public could providers (such as Amazon web services (AWS)) are not using EMC and VMware products and services which takes away the growth aspect. Most cloud customers are startups and small and medium-sized businesses. However, public could providers such as AWS and Google are expected to shift focus to large companies soon, heading right into EMC’s and VMware’s sweet spot, which could be a big threat.
Analyze: EMC’s management very well understands that public cloud is a threat and are taking very aggressive measures to mitigate the revenue loss in information storage segment by launching new emerging storage offerings. Also, to compete on the public cloud front, VMware has recently launched vCloud Hybrid. Hybrid cloud is a system that combines public cloud with a compatible private cloud. The private cloud holds crucial data and applications, while the public cloud offers scale and superior pricing.
Though start-ups and even smaller and medium business IT departments are moving towards subscription based public cloud services to save cost the larger enterprises, especially those that have long established investments in on site infrastructure are not. Main reasons why public cloud hasn’t been able to penetrate in larger organizations are:
- With investments already made and networks set up, public cloud could actually be more expensive for them.
- Security is a big concern for these established companies and hence they are not comfortable with external service offerings.
- Big organizations include applications such as Exchange servers, Windows servers, and Oracle databases. Retrofitting these platforms for a public cloud provider such as AWS is no small task.
To transform and improve business, CIOs have to find efficiencies in their current IT environment. EMC supports the vast majority of enterprise customers contained in these environments (is a market leader) and hence is well positioned to help customers optimize and modernize their current IT needs by transitioning from existing exchange-servers to emerging technologies such as converged infrastructure, software defined data center and private cloud.
Lastly, EMC and VMware have launched Pivotal, which will provide enterprise-class cloud-computing platform and infrastructure and big data for VMware customers.
2. Open source virtualization software’s: Some companies and public cloud service providers are gravitating towards free and open source virtualization such as Citrix’s (CTXS) XenServer and not VMware’s virtualization software.
Analyze: Though Citrix’s (CTXS) XenServer is freely available its market share in the segment is very small and has been declining. Support, service and maintenance are very important for IT departments which VMware is good at. VMware is a leader with 55% share of the virtualization market.
3. Increasing competition and declining market share for VMware: Market share of VMware has been constantly declining over the last few years (declined to 55% in 2013 from 65% in 2008). Comparatively, Microsoft’s share in the market has gone up from around 20% at the end of 2008 to 28% in 2013.
Analyze: Competition has been increasing with companies like Rackspace, Microsoft, Google, Amazon, and others entering the market. Though VMware’s market share has been declining with increased competition, overall server virtualization market is growing and is still expected to grow 18% annually. VMware has grown its revenues by 23% cagr in last 5 years and growth in FY13 was 13%. VMware is still the market leader with 55% market share and its new internal and acquired technologies should further boost revenues and market share.
4. Majority of the revenues come from information storage segment which is a declining business: Information storage segment makes up 70% of revenues and virtualization 23% of revenues. Information storage business is in a secular decline.
Analyze: Overall enterprise information storage market is growing at a very small pace (1% to 2%) in dollar terms. Though the need for data is unstoppable and is growing exponentially, the slow growth has been mainly due to reduced pricing, database appliances that manage more in-memory computing and fast growing adoption of cloud offerings and software-defined storage that reduce enterprise hardware needs. Hardware market has stagnated at current levels as price declines offset most of the growth in unit shipments. That said, EMC is the market leader and has been taking market share from competitors. Its information storage revenue (70% of total revenues) increased by 4.5% in FY13 and its market share in the storage hardware segment increased to 33% in 4Q13, which is double IBM (second in the list) and triple its nearest competitor, NetApp (NTAP). The company is gaining market share because of its strongest and most complete portfolio, aggressive focus on R&D and innovation along with right acquisitions leading to outstanding new emerging technologies and solutions and excellent service. Also, storage software is growing and is expected to achieve a 7% growth in the next two years. EMC is the market leader in both storage hardware and software with a 34.2% and 23.6% share in them respectively.
Catalysts:
1) Sticky business: EMC operates in a very stick business as it has long-term relationships with its customers and the solutions are sold through multi-year enterprise license agreements. Also, it takes a significant amount of time and effort to set up the networks and servers which makes it difficult for existing customers to move.
2) Faster growing latest emerging storage offerings: Though the overall growth in information storage market is stagnant, EMC has been growing its information storage segment revenues (70% of total revenues) by approximately 5%. The growth isbeing driven by smaller, but much faster growing emerging storage offerings. These latest emerging storage solutions like Isilon (network attached storage), Atoms (cloud storage), VPLEX (virtualization and private cloud) and XtremIO (all-flash storage array) are growing exceptionally well: up 54% in FY13 recording a revenue of USD 1.5bn. In less than two months of availability, XtremIO has already taken the market-leading position and combined product sales for Atmos and Isilon more than tripled in FY13. Also, new products such as ViPR, software-defined storage solution, significantly speed up performance. ViPR got off to a very strong start in 4Q. In September 2013, EMC also launched the new VNX Series, which delivers up to four-times the performance of the previous generation. These latest emerging storage offerings have had y-o-y growth of 73% in 4Q13 and 66% in 3Q13. Although this sub-segment (emerging storage) only contributed about 10% of the USD 16bn information storage segment, the momentum and the growth in these emerging storage offering could boost storage business. EMC intends to focus on emerging storage going forward.
3) VMware is growing: EMC owns 80% of VMware (VMW), which has the largest market share in providing virtualization to enable enterprise customers to deploy private clouds. Medium-sized enterprises are still in the early stages of deploying a server virtualization and this market is expected to grow 18% annually. VMware is uniquely positioned as i) it offers solutions which run on industry-standard desktop computers, servers and support a wide range of operating systems, application environments and networking and storage infrastructures and ii) it is 80% owned by EMC and hence has access to the massive EMC clientele and relationships. VMware has been growing its revenues and FCF by 23% and 29% cagr in last 5 years (13% and 32% in FY13), respectively.
Also VMware is attempting to become a cloud management provider, which is a transformation from offering primarily server virtualization solutions. VMware only recently released its vCloud Hybrid Service and made it available in the US in September 2013. It will roll out this service in other regions throughout 2014. The hybrid cloud service has gained tremendous popularity and despite competitive environment the company’s management tools for cloud are selling very well. Also, its vCloud Government Service is expected to be available in 2H14.
Just like EMC, VMware is also focused on innovation. In November 2013, VMware launched desktop as a service (DaaS) offering, with the goal of simplifying the delivery of cloud-hosted desktops, to any device, anywhere. DaaS is a cloud-based desktop service that delivers virtual desktops running on VMware’s vCloud Hybrid Service. It gives customers the ability to blend public cloud desktops and on-premise VMware private cloud desktops. VMware is also adding virtualized GPU (vGPU) by bringing Nvidia GRID technology to its DaaS platform. This gives VMware 30 million potential users: designers, project managers, engineers, and power users. GPU helps delivering a quality interactive visual experience and has been increasingly used even in mainstream Microsoft Office 2013 and rich HTML5 content on internet.
Lastly, VMware acquired AirWatch, the leader in enterprise mobile management and mobile security, providing software tools required by IT organizations to manage, monitor, and secure mobile devices in their enterprise. This helps organizations empowering the mobile workforce.
Apart from growing virtualization market, VMware will be able to pace the delivery of all these services and solution (DaaS, vGPU, AirWatch) through its network of over 11,000 VMware service provider partners further accelerating its top-line growth.
4) Relationship with existing clients: Vast majority of enterprise workload is supported by client-server era, in which EMC is the market leader. With EMC’s massive clientele and long term relationships and VMware’s seamless integration with EMC products, EMC is better equipped to help customers bridge the gap as they transition from the client-server to cloud computing, big data, mobile, and social networking.
5) Integrated with most big enterprise applications and technology alliances: During 2013, EMC continued to deepen the level of integration between its data protection hardware and software products, as well as with enterprise applications from Oracle, SAP and Microsoft and virtual infrastructure from VMware and Microsoft. This integrated approach to delivering solutions helps users address challenges associated with exponential data growth, physical-to-virtual migration and cloud computing initiatives. EMC also engages in numerous alliances with other technology companies for interoperability, seamless integration and hence improved the total customer experience. In 2013, EMC delivered significant technology integration and new solutions for SAP, Cisco, Brocade, Citrix, Microsoft, Oracle and VMware to help accelerate customers’ journey to private, public or hybrid cloud. It also expanded its partner ecosystem with global and regional technology and solutions providers.
6) Strong distribution network and sales force: One of the EMC competitive advantages is its massive direct sales force and distribution network. EMC markets its products and services through direct sales (in North America, Latin America, Europe, the Middle East, South Africa and the Asia Pacific region) and through multiple distribution channels (including value-added resellers and distributors, cloud service providers, systems integrators, outsourcers, independent software vendors, and original equipment manufacturers). EMC and VMware have demonstrated to be market leaders by continuing to dedicate significant resources towards expanding their product scope organically and through acquisition and then maximizing those investments by leveraging their significant distribution capabilities.
7) Focus on innovation with massive R&D expense: The current need for innovation is extremely important as the IT infrastructure market is going through the biggest and most disruptive (and opportunistic) transition. Withinternal annual R&D expense of USD 2.7bn and 15,000 engineers, it is difficult to beat EMC on innovation. Investment in R&D and new technologies and solutions is reflected in numerous innovations, refreshes and successful product launches in 2013. The company continues to develop a product portfolio with customers’ current and future needs in mind.The company continues to make major investments in new business areas including NSX, DCHS Pivotal, ViPR, ScaleIO, XtremIO and Project Nile.
8) Smart acquisitions with strong sales force help reach the product to its massive client base: EMC acquired eleven companies in FY12 and five in FY13. It has a track record of making smart acquisitions and have generated very attractive ROIs on them. Examples include VMware, Data Domain and Isilon. EMC’s strong sales force and partner network help reach the product to its massive client base which creates such attractive returns.
9) Top-line growth faster than it shows: Growth in EMC’s unearned revenues has been much faster than the actual growth in the top-line revenues. Revenue growth was 8.5% and 6.9% as compared to growth in unearned revenues of 22% and 19%, in FY12 and FY13 respectively. This shows the growth has been faster than actually depicted in the revenues.
10) Capex cycle: Cash on companies’ balance sheet is at its all time high but investment in technology has dropped to a near-15-year low as a share of overall investment. Average age of equipment is 7.4 years, the oldest since 1995. Average age of even quickly-depreciating assets like software and information processing equipment is at historical peaks. IT spending could increase significantly with an upturn in the capex cycle.
11) Pivotal: Large volumes of complex data generated by increasing use of smart devices have initiated the need for big data. Smart phones, tablets and new PC form factors are only the beginning. This trend will accelerate as sensors are built into almost every imaginable product that will collectively throw massive amounts of data. The world’s data is expected to expand at a cagr of almost 40% from 2013 to 2020. This data is stored in new clouds quickly and affordably. New and powerful cloud infrastructures provide technology that organizations can use to mine through massive quantities of data and enable them to use their findings to identify new business opportunities, trends and to make better and faster customer-focused decisions by understanding client needs and behavior while improving their operational efficiencies. Pivotal (launched in April 2013 and 84% owned by EMC) is a USD 1bn initiative, offering Platform-as-a-Service (PaaS) to target next-generation cloud and Big Data, as well as agile development tools. It is spun out of VMware, and backed by EMC and GE. The total investments to Pivotal are expected to be USD 400m, most of which will be coming in 2014. Pivotal is predicted to see exceptional growth with potential to exceed revenue of USD 1bn by FY17. A recent IDC forecast shows that the Big Data technology and services market will grow at a 27% cagr to USD 32.4bn through 2017. Pivotal currently contributes just 1.3% of total revenues and could be a huge growth engine for the company in the future.
12) Share buyback and potential shareholder activism: EMC continues to spend more cash on share repurchases. It repurchased USD 3bn, USD 685m and USD 2bn of its common stock from the market in FY13, FY12 and FY11, respectively. In FY12 it also repaid USD 1.7bn of long and short-term debt. In FY13 it issued USD 5.5bn of debt at a weighted average interest rate of 2.4%, taking advantage of the low interest rate environment. Most of this money will be used for stock repurchases and dividend payments. The company expects to spend another USD 2bn on EMC share buybacks in 2014. As per the company, combined payouts of dividends and share repurchases are seen around 50% of free cash flows. With strong annual free cash flow of USD 5.5bn and a massive USD 17.6bn of cash on balance sheet (31% of the market cap) buyback could only increase and the company could be a target for shareholder activism.
13) Valuation:
i) Multiples: EMC is trading at 10x Enterprise Value (EV)/FCF and 8x EV/EBITDA, about lowest historically (even lower than 2009). This is an extremely low valuation for a net debt free technology company, growing its revenues and FCF by 13.6% and 21% on average. In FY13 revenues and FCF grew by 7% and 10%, respectively. The company operates with average FCF margin of 22% and a consistent roce of more than 60%. Assuming a 5 year cagr of 2.8% in top-line and reducing FCF and EBITDA margins by 50bps each year, at current price, EMC trades at a future FY18 multiple of 7.3x EV/FCF and 5.1x EV/EBITDA, as modeled. This also assumes approximately USD 1.6bn (almost 30% of FCF) is used for acquisitions every year. These are extremely low multiple even at a very conservative growth rates. The company expects much higher growth and margins to improve slightly. Twice these multiples (100% appreciation) would be a minimum justification for a market leader in this segment.
ii) DCF: On average EMC’s FCF has been growing by 21% for last 4 years and grew by 10% in FY13. Assuming a conservative growth rate of 3% for next 5 years, a terminal growth rate of 1%, and a discount rate of 10% gives a stock price 20% above its current trading level. This clearly depicts an undervaluation even at minimum growth rates.
iii) Sum of parts:
VMware has had a 5-year average growth of 23%, 26% and 32% in revenues, EBITDA and FCF, respectively. Last year (FY13) revenues grew by 13%, EBITDA by 18% and FCF by 32%. Assuming a 10% growth rate for next 5 years, a terminal growth rate of 1.5%, and a discount rate of 10% gives a stock price trading at approximately current levels.
Standalone EMC: However, EMC on a stand-alone basis (stripping VMware), is trading at extremely cheap multiples (5.4x EV/FCF and 3.6x EV/EBITDA). The core EMC (stand-alone) seems significantly undervalued considering it is a market leader, has been growing its top-line by 5% and taking market share from competitors. Its competitor for stand-alone business NetApp (NTAP), trades at 7.5x EV/FCF and 6.6x EV/EBITDA. Valuing at those multiples suggest an approximate 80% upside on the core EMC (stand-alone) and an approximate 30% upside on the consolidated EMC. Valuing EMC (stand-alone) using a -1% growth rate in FCF for next 5 years, -1% terminal growth rate, and a discount rate of 10% gives a stock price approximately 70% above current trading levels, and a 23% upside on the consolidated EMC. These assumptions are really conservative as revenues from the EMC (stand-alone) grew by 5.2% and 4.5% and EBITDA by 10.1% and 3.7% in FY12 and FY13, respectively.
Even under such conservative assumptions EMC (stand-alone) is significantly undervalued. These valuations remind me of hard disk drive (HDD) manufacturers, WDC and Seagate. In mid 2012 WDC was trading at EV/EBITDA of 3.5x. The rationale behind such low multiples was that HDD manufacturers will not survive as solid state drives (SSDs) are the future. Since then WDC stock has almost tripled. HDDs are still sold and are very much alive.
Conclusion: EMC is trading at a discount even on a very conservative basis and the market is ignoring its competitive advantages including quality, breadth of offerings, strong distribution (sales force and channel partners), after sales service, scalability, interoperability, time-to-market enhancements and expertise in acquiring new emerging technologies with power to scale them. Furthermore its huge cash pile (31% of the market cap), high roce, 10% FCF yield and growing emerging segments are also overlooked. The stock has been down 8% in last 2 years as compared to a 32% gain in S&P on fears of client-server and data storage systems being obsolete with emergence of public cloud. In those 2 years EMC has recorded an average top-line growth of 7.7% and FCF growth of 11.7%.
EMC is taking very aggressive measures to mitigate the revenue loss in information storage segment and so far has been very successful in doing the same. It is well positioned to benefit from the current growth segments of IT: big data, cloud, virtualization, storage, security, and software-defined storage.
Disclosure: Long EMC, NTAP
Disclaimer : This is not an investment advice. DO NOT make any investments based on this article. Please read the disclaimer in detail.
XIV: 30% upside in 3 to 6 months
Trade: Long XIV (short term trade) Current price: 26.6 Expected price: 34.6 Upside: 30% Time horizon: 3 to 6 months
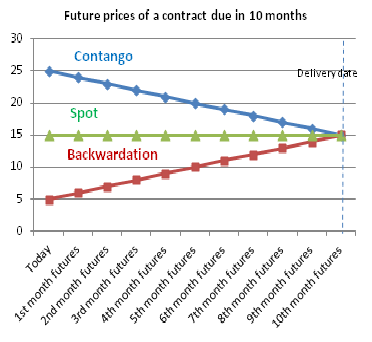
VIX measures 30 days implied volatility of the S&P 500 options. It rises when markets are down and can increase significantly in a day depending on the velocity of the fall. When VIX remains normal to low, we see contango in the VIX futures, which means future prices are above spot price (see figure below). In contango, future prices (which are at a premium to spot price) can be shorted and covered on or before the contract expiration to make a profit (aka roll yield), as future prices decline to converge to spot price as they get closer to expiration date (see figure below).
When VIX spikes, we see backwardation in the VIX futures. In backwardation future prices trade below spot prices (see figure below) and one can play exactly opposite to contango (go long futures and cover the position on or before the contract expiration) to make a profit.
For VIX, there are two important points to consider:
1) Mean-reversion: VIX is the most mean-reverting thing and even in the worst recessions, it hasn’t stayed at elevated levels. It would spike up and then go back to its mean or lower than mean. Below table shows percentage of times VIX has spiked since its inception in 1990 (24 years of historical data), and has remained at those levels.

When VIX level reaches 22 or more, shorting VIX becomes a high probability bet, at least historically. As of 3 February 2014, VIX closed at 21.44. Historically VIX has been at or above those levels only 35% of the times, which means approximately 65% of the times its been below 21.44. Also, at these elevated levels probability of increasing even higher decreases exponentially. For example, as evident in the table above, historically VIX of 22 and above has been recorded only 32% of the times; but 24 and above only 24% of the times. In essence, if VIX spikes up at levels above 22ish, the probability that it will go even higher reduces significantly.
2) Contango: The other advantage of shorting VIX (volatility products) at these high levels is that, historically, VIX futures have been in contango more than 70% of the time and in backwardation less than 30%. As mentioned above, contango is good for shorting VIX futures.
XIV tries to replicate the inverse of the daily performance of VIX. XIV shorts varying amounts of the front and second month VIX futures contracts and covers at expiration. Because of this, XIV collects roll yield, which can be positive or negative depending on whether the VIX term structure is in contango or backwardation, respectively. Since more than 70% of the time VIX is in contango (as mentioned in point 2 above), XIV generates positive yield most of the times. However, since XIV is an inverse ETF and is rebalanced every day, this results in a quite a bit of time decay. XIV has a high volatility, which also means bigger time decay losses.
That said, XIV can be very interesting for short-term trades if you buy it on VIX spikes and sell it in a few months when volatility subsides, due to its mean-reversion nature. As of 3 February 2014, VIX closed at 21.44. As mentioned above, historically VIX has been at or above those levels only 35% of the times, which means approximately 65% of the times its been below 21.44. This means shorting VIX (volatility related products) or going long XIV is a high probability bet. Also, I think the current fall in the market is a correction and VIX should revert back to lower levels. If it does, XIV could see an upside of 30% or more in 3 to 6 months.
Lastly, if you look at chart below, it shows that this is a 3 standard deviation event for XIV, which has never sustained and prices have always risen from such a dramatic decline (mainly due to VIX mean-reversion and that historically VIX futures have been in contango more than 70% of the time).
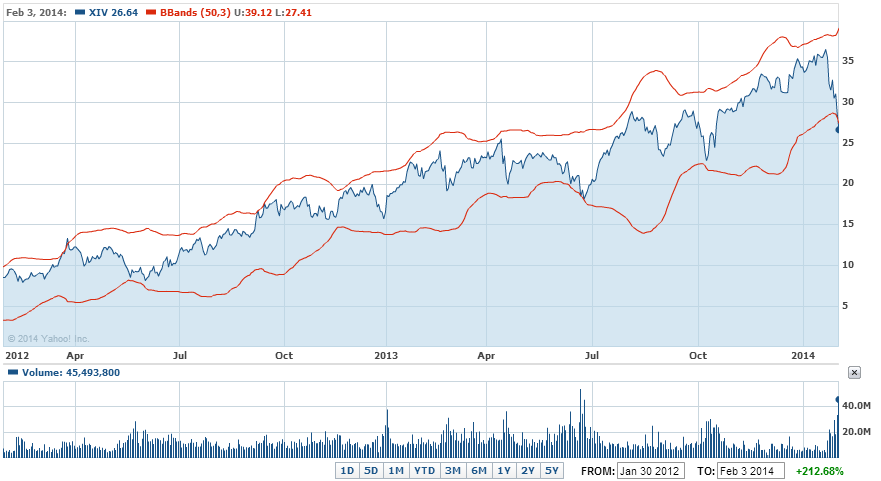
source: Yahoo finance
Disclosure: Long XIV
Market Timing, key to generating significant alpha
It is very common saying that “market cannot be timed”. Our models below prove that wrong showing a very high probability of timing long-term market tops and bottoms.
We believe in combination of quantitative and fundamental analysis. For timing the market, we try to understand the market as science and constantly experiment by back-testing combination of diverse data-points.
Below models convert our belief in cyclicality, irrational human behavior and market inefficiencies into science by developing 6 proprietary signals (5 contrarian and 1 trend following) indicating long-term market tops and bottoms. When back-tested, one or more of our market timing indicators predicts every fall of more than 15% in S&P since 1965.
Our belief is that market-timing is the key to making big returns and beating the market. Getting one big event right or following one big trend for years and avoiding a downturn can generate significant alpha.
Below are the models:
Interest rates:
This indicator only gives sell signals based on a proprietary formula. It tells when to go on defensive mode and hedge the portfolio from potential losses. The indicator has captured major downturns in S&P such as
1966 (-18% after signal in 8 months),
1969 (-26% after signal in 12 months),
1973 (-39% after signal in 15 months),
1980 (-10% after signal in 1 month),
1981 (-19% after signal in 15 months),
2000 (-46% after signal in 25 months) and
2007 (-45% after signal in 29 months).
It has given 10 signals since 1962, of which most were well-timed and some a little early in the cycle. The indicator is updated on a monthly basis and is a great source to hedge or make an asymmetrical bet. Below is the chart (circled are the ones when the signal did not work).


Speculation:
This is a contrarian indicator which gives buy and sell signals, based on a proprietary formula. It gauges speculation in the market. It gives sell signal when speculation reaches its peak, and vice-versa. The indicator has 100% accuracy when backtested. It gave S&P 500 sell signals in
1972 (-41% after signal in 26 months),
1983 (-7.4% after signal in 10 months),
2000 (-45% after signal in 32 months),
2007 (-51% after signal in 20 months) and
buy signal in
2009 (61% after signal in 25 months).
The indicator is updated on a monthly basis. Below is the chart:


Business cycle:
This is a contrarian indicator which gives buy and sell signals, based on a proprietary formula. It gauges tops and bottoms of a business cycle. The indicator gave S&P 500 buy signals in
1957 (34% after signal in 14 months),
1970 (16% after signal in 13 months),
1974 (42% after signal in 19 months),
1980 (24% after signal in 9 months),
1981 (38% after signal in 20 months),
1990 (36% after signal in 15 months),
2002 (22% after signal in 15 months) and
2008 (22% after signal in 18 months).
It gave S&P 500 sell signals in
1958 (did not work),
1966 (-17% after signal in 8 months),
1972 (-40% after signal in 30 months),
1978 (did not work),
1983 (-8% after signal in 9 months) and
2007 (-51% after signal in 20 months).
The indicator is a great way of making an asymmetrical bet or hedging the portfolio. It is updated on a monthly basis. Below is the chart (circled are the ones when the signal did not work).


Fundamental economy:
This is a contrarian indicator which gives buy and sell signals, based on a proprietary formula. It gives long term bull or bear market indicators. It gauges overheating and irresponsible spending (sell signal) and extreme conservativeness and low points (buy signal) in the economy. The indicator gave S&P 500 buy signals in:
Early 1962: 2% in 12 months but S&P gaining approximately 40% in a continued bull market for next 4 years,
Mid 1993: 1.3% in 12 months but a continued bull market for next 7 years until 2000, with S&P gaining more than 200%,
Early 2009: 35% in 12 months and a continued bull market until now (2013),
Late 2010: 19% in 8 months and a continued bull market until now (2013).
while the sell signals were given in:
2000 (-38% after signal in 23 months) and
2007 (-50% after signal in 19 months).
This indicator is updated on a monthly basis. Below is the chart.


Price growth:
This is a contrarian indicator which gives only sell signals. It gives warning for extreme growth in price. The sell signals were recorded on:
February 1929: -18% after signal in 18 months
November 1936: -44% after signal in 18 months
April 1956: -17% after signal in 19 months
August 1987: -27% after signal in 4 months
July 1998: -14% after signal in 1 month
One wrong signal was given in July 1997 (circled).
The indicator is updated on a monthly basis. Below is the chart.


Trend following:
This is a trend following indicator which gives buy and sell signals, based on a proprietary formula. Basic goal for this signal is to catch the big up-trends in the market and avoid/short significant falls and downturns. It has done a great job by producing a return of 11.7% cagr, as compared to the S&P return of 7.1%, since April 1994 until November 2013 (approximately for last 20 years). Below is the chart:


Apache (APA): undervalued with an enormous optionality on natural gas upside
Trade: Long APA, Short Brent crude
APA Current price: $87
Expected price: $122
Time: 1-2 years
Catalysts: recent strategic acquisitions which have huge potential still to be capitalized, room to improve margins, significantly undervalued to peers, trading below 2008 levels on valuation basis, diversified asset base, enormous optionality on natural gas upside, capex peaking out in 1-2 years, divestures to reduce debt, recently initiated buy-back program, possible shareholder activism.
| Price |
85.04 |
P/tangible book |
1.11 |
Forward P/E |
9.1 |
| Market cap | 33,235 | P/E |
17.26 |
P/Sales |
1.95 |
| EV/EBITDA |
3.73 |
EV/OCF |
5.34 |
EV/FCF |
-44.23 |
| Leverage (Debt/EBITDA) |
1.01 |
P/OCF |
3.91 |
P/FCF |
-32.36 |
Underperformance:
While many oil names just touched their 52-week high, Apache recently touched its 52-week low. The stock reached a peak of 130 in mid 2011 and is currently trading at mid 80s. The fall has been due to significant acquisitions financed via debt and excessive capital spending (capex) on the newly acquired assets, resulting in significantly lower profits, low dividend payments and slower than expected growth. Significant capex outpaced operating cash flow in FY12 resulting in negative free cash flow (FCF). FY12 EPS declined by 56% and recent 1Q13 quarterly EPS declined by 12%. Revenue for the recent quarter (1Q13) declined 10%, on a y-o-y basis.
Additionally, political turmoil in Egypt, where the company generates 20% of its current production, 30% of its current operating cash flow and has 10% of its reserves, is also one of the main reasons for the stock to remain undervalued.
Situation in Egypt:
In February 2011, the former Egyptian president Hosni Mubarak stepped down, and the Egyptian Supreme Council of the Armed Forces took power, announcing that it would remain in power until the presidential and parliamentary elections could be held. In June 2012, Mohamed Morsi of the Muslim Brotherhood’s Freedom and Justice Party was elected as Egypt’s new president. This political turmoil comes with potential threats such as deterioration in the political, economic, and social conditions or changes in laws or regulations in the region, export restrictions, nationalization of APA assets and/or forced renegotiation or modification of existing contracts with the government of Egypt. Management is completely aware of this problem and has met with Egyptian officials, kept production steady, and is actively monitoring the situation. A per management, assets are in very remote areas, and hence the drilling wasn’t affected even while protests engulfed the major cities. The problem is the fear of nationalization of the assets. Losing Egyptian assets would mean a direct 30% hit to APA’s operating cash flow. Apache does mention that as a risk in its recent filing. However, the company continues to receive development lease approvals for drilling in Egypt and plans to invest USD 1.1bn in the region in FY13, highlighting that the situation is not as bad as it seems.
Grown on acquisitions:
The company has grown through acquisitions financing it via debt. The strategy has been to acquire strategic and rich assets at a decent price and then focus on getting value out of them. From 1999 to 2003 APA went on an international acquisition spree to acquire oil rich international assets. From 2009 until present it did the same in the US, focusing on shale plays in the mid-con. During FY10-FY12, APA completed USD 17bn in acquisitions (compared to current book value of USD 30bn), leaving a lot of room for growth in the future. The timing of these acquisitions has been right due to low cost of financing. By acquisitions the company has grown its tangible book value by 11% cagr in last 5 years and 17% cagr in last 10 years. Below is the list of acquisitions:
2012 (Canada): Kitimat, BC, partnership with Chevron: In December 2012, entered an agreement with Chevron to build and operate the Kitimat LNG project. Each will become 50% owner of the proposed Kitimat LNG plant, the Pacific Trail Pipeline, and 644,000 gross undeveloped acres in the Horn River and Liard basins.
2012 (US): Central Anadarko basin acquisition: In April 2012 acquired Cordillera Energy Partners III, LLC (Cordillera), for USD 2.7bn in cash and approximately 6.3 million of APA common stock, increasing the diluted outstanding shares by 4%, from FY12. Cordillera’s properties include approximately 312,000 net acres, basically doubling APA’s position in liquids-rich Anadarko Basin. APA issued USD 5bn fixed-rate long-dated notes in 2012 at an average rate of 3.5% for the acquisition and to pay down maturing debt and commercial paper balances.
2012 (Australia): Yara Pilbara Holdings Pty Limited acquisition: In January 2012, acquired a 49% interest in Yara Pilbara Holdings Pty Limited (YPHPL, formerly Burrup Holdings Limited) for USD 439m. YPHPL is the owner of an ammonia fertilizer plant on the Burrup Peninsula of Western Australia.
2011: North Sea acquisition: In December 2011, acquired Mobil North Sea Limited from Exxon Mobil for USD 1.25bn, adding to other North Sea assets it acquired from BP a decade ago.
2010: Gulf of Mexico Shelf acquisition: In June 2010, acquired oil and gas assets in the Gulf of Mexico shelf from Devon Energy Corporation for USD 1.05bn.
2010 (US): Permian acquisition: In August 2010, acquired acreage and infrastructure in the Permian Basin for USD 2.5bn, net of preferential rights, from BP’s oil and gas operations.
2010 (Canada): Canadian acquisition: In October 2010, acquired BP’s upstream natural gas business in western Alberta and British Columbia for USD 3.25bn.
2010 (Egypt): Egyptian acquisition: In November 2010, acquired BP’s assets in Egypt’s western desert for USD 650m.
2010: Mariner merger: In November 2010, acquired Mariner Energy, Inc. for stock and cash consideration totaling USD 2.7bn. APA also assumed approximately USD 1.7bn of Mariner’s debt with the merger.
Catalysts:
1) Focusing on extracting value from assets acquired: CEO, Steve Farris, mentioned in the 1Q13 earnings call that the company has done enough acquisitions and will now focus on extracting value from them. This would mean high initial capital expenditures on these projects to get them started. APA has an expected capex of USD 10.5bn for FY13. Capex (excluding acquisitions) has increased significantly by 36% in FY10, 44% in FY11, 35% in FY12 and an expected 10% in FY13. Of the USD 10.5bn in FY13, main focus will be onshore North America shale play regions with a dedicated USD 4.6bn capex. USD 2.2bn will be on other projects such as Australian oil developments, Gulf of Mexico deepwater, Wheatstone project, and Kitimat, BC. These significant capex spending would have noteworthy increases in production in the future. Also, with capex peaking in 1-2 years, it would decline in the future boasting free cash flow considerably in years to come. Below are details of the future projects:
i) US shale play: The US contributes 40% of the total production (17% oil, 4% NGL, 18% gas). The Permian, Anadarko and Central Region assets (on-shore U.S. assets related to shale) have huge potential in horizontal drilling with over 88% of the company’s resource potential going forward. That’s where APA has seen the most growth in recent years with liquid production (oil and natural gas liquids (NGLs)) in the US growing by 16%, 28% and 19% in FY10, FY11 and FY12, respectively. In 1Q13, oil production from the US was up 19% and NGLs production 121%, on a y-o-y basis. Natural gas production was only up by 4% as the company is keeping gas production flat due to depressed prices. The US is the strong growth region for the company with its huge recently acquired shale plays. As of 1Q13, about 44% of the current production and 50% of the estimated proved reserves are in the US, a very safe region. In FY13, Apache plans to direct USD 4.6bn of total capex (40%) toward North American onshore regions (mostly in the Central and Permian regions). This focused drilling program should help Apache deliver 25% y-o-y growth in North America onshore liquids (oil and NGL) production.
ii) Kitimat, BC: Canada contributes 16% of the total production (2% oil, 1% NGL, 13% gas) and has 19% of the estimated proved reserves. In Western Canada Apache is working with Chevron on developing the Kitimat LNG project to provide an export route for 50 billion cubic feet of gas reserves in that region. This will increase the total production by 3%. In FY12, Chevron paid Apache USD 400m to buy a 50% stake in Kitimat. The Kitimat plant has received all significant environmental approvals and a 20-year export license from the Canadian federal government. Kitimat is one of the closest ports to the Asian markets, especially Japan, where LNG prices are currently at USD 16 per Mcf, 3x as compared to that in Canada.
iii) Australian oil developments: The company has interests in 30 exploration permits, 17 production licenses, and 13 retention leases that cover a total area of 7.9 million gross acres located in offshore Western Australia. Approximately 90% of this acreage is undeveloped contributing 12% of FY12 estimated proved reserves. Australia contributes 9% of total production (4% oil and 5% natural gas). The production in the region will more than double, increasing by 110% over next 4 years and contributing additional 10% to the total production, with major projects including Macedon (2013), Balnaves (2014), Coniston (2014) and Julimar/Wheatstone (2016) coming online.
iv) Wheatstone LNG: In Australia APA has a 13% piece of Chevron’s giant Wheatstone LNG project, which will come on line in 2016. After coming online, the production is expected to be 11 million barrels of oil equivalent (4% of current total production) annually for 20 years. LNG rates in Australia are at USD 8/MCF, more than double that in the US. APA will be the biggest domestic gas supplier in Western Australia by FY13. APA’s Australian subsidiaries have been already signing long-term sales and purchase agreements for supplying LNG to Asian companies.
v) Forties Alpha: The start of the Forties Alpha satellite platform should add to Apache’s production growth in 2013 (3%-5%) and more than offset the natural field declines continuing in Australia, Canada and Argentina.
vi) Egypt: Egypt is a cash-cow for the company as it generates USD 2.7bn operating cash flow of which USD 1.1bn is spent on capex, with remaining USD 1.6bn in free cash flow, that is used for other parts of the business. The region provides 20% of total production (13% oil and 8% gas). Average sale price of oil in the region is one of the highest at USD 111 per bbl. APA announced three new discoveries in the Western Desert of Egypt during 1Q13, extending the company’s production. The region has 10% of FY12 estimated proved reserves. Even with all the turmoil, the company have continued to receive development lease approvals for drilling in Egypt and plans to invest USD 1.1bn in the region in FY13.
vii) North Sea: North Sea provides 9% of total production (8% oil, 1% gas). The region has one of the highest average sale price for oil (108 per bbl) and natural gas (8.95 per Mcf). APA increased its portfolio in the region by acquiring Mobil North Sea Limited in FY11, which provided the region with additional exploration and development opportunities across numerous fields. This resulted in a y-o-y production increase of 37% in FY12 in the region. The region has 6% of total estimated proved reserves.
2) Reduction in executive pays due to underperformance: Due to significant underperformance of the stock among its peer group, the board has reduced the compensation of CEO, Steve Farris, who is also the chairman, by 18% as compared to previous year and bonus to 150% of the base salary from 200%, as per SEC filings. The shareholders did not pass an advisory vote on compensation of executive officers during the annual meeting on 16 May 2013. Also, the total director compensation was being reduced to USD 300k from USD 350k, with a cut in the equity component of the pay package. Overall, this puts pressure on the management for better performance. I think, the board and the CEO are fully aware that activist shareholders can take greater positions anytime and shake things up if the management does a sloppy job with good assets and doesn’t create value. We have recently seen a lot of shareholder activism in oil and gas sector such as Hess, Transocean and Chesapeake.
3) Divestures, reduction of debt and share buybacks: On 9 May 2013, APA reported 1Q13 earnings and announced a plan to divest USD 4bn in assets by year-end 2013. The company recently hired Goldman Sachs to unload shallow water Gulf of Mexico assets. Another likely divestiture could be Argentinean assets. Fortunately oil prices have remained high, so the company should get good value. APA intends to use USD 2bn to reduce debt and another USD 2bn to repurchase stock under a 30 million share repurchase program. With a current market cap of USD 30bn, this is approximately 7% share buy-back program and puts some floor on the stock price, in case of a fall. Divesting potentially heavy future investment non-core assets, reducing debt and buying back stock would create more value.
4) Recent hedge fund and Insider buying: In 1Q13, quite a few hedge funds were buyers of the stock including T Boone Pickens, Wallace Weitz, Brain Rogers, Third Avenue Management, NWQ Managers, Manning and Napier Advisors, Inc. Diamond Hill Capital, Richard Pzena, George Soros, Louis Bacon, Charles Brandes, Jeff Auxier, Paul Tudor Jones, Jeremy Granthan and Ray Dalio. In Feb, March and April 2013, we saw some insider buying as well.
5) Margins and cost efficiency: APA has lower margins than its peers but that’s where it has the opportunity to improve. OCF margin has declined from an average of 55% in last 6 years to 50% in FY12, due to significant declines in natural gas prices. Also, acquisitions had deviated management focus. However, the acquisition spree has ended and APA is now focusing on costs by reducing drilling days and frac cost by self sourcing and optimizing frac design. With shareholders ousting executives and revamping boards because of poor performance, the pressure to improve margins and be cost efficient is real.
6) Natural gas play with diversified asset base: The company is a less-levered play for the potential upside in the natural gas, due to its diversified asset base both within the U.S. and internationally. If gas prices soar, Apache’s top quality on-shore assets could significantly increase profitability. As of FY12, 45% of APA’s production was oil and 49% natural gas. That said, 78% of revenues come from oil and only 19% from natural gas. This is due to drastic declines in natural gas prices, which has forced APA to focus on liquids where margins are higher and keep natural gas production flat. APA can boost its production with an increase in natural gas prices which could have a significant upside on its revenues and bottom-line. Also, APA took heavy write-offs on its various natural gas assets last year due to lower prices. Increase in natural gas prices would also increases the value of those assets on balance sheet, growing the book-value. Below points highlight the potential increase in natural gas prices.
i) Natural gas prices have declined by 70% in last 5 years, to USD 3.9 mmbtu in June 2013 from USD 13.2 mmbtu in June 2008. This has created a huge divergence between price of oil and natural gas. The chart below shows price of natural gas (per barrel of oil equivalent) as a percentage of oil price. On average in FY12, natural gas was 24% of oil price in the US for one barrel of oil equivalent. This means it could be bought at a 76% discount to oil. This energy source will be exploited in the future and price differential will not remain at these levels.

ii) Many power plants are opting for the cleaner burning natural gas to replace coal and some of that transition is permanent.
iii) Major manufacturers of chemicals, steel, etc are increasing their utilization of, or shifting to, cheap natural gas to lower their overall cost structures. In this case as well, some of the transition is permanent.
iv) At present, global natural-gas markets are not integrated. Prices are USD 0.75 Mcf in Saudi Arabia (subsidized by government), USD 3.9 Mcf in the US, around USD 12 Mcf in Europe and as high as USD 16 Mcf in Japan. Overtime market forces will narrow this gap. One such way of exploiting this arbitrage is exporting it to Asia. Export will eventually open up reducing the arbitrage and increasing natural gas prices.
v) Compressed natural gas (CNG) vehicles are very common in Asia. As of 2011, worldwide, there were 14.8 million vehicles that run on compressed natural gas (CNG), with approximately 5.7 million in the Asia-Pacific region followed by 4 million vehicles in Latin America. This number has been growing rapidly as CNG is a much cleaner fuel and produces much less pollution, is significantly cheaper than oil (Asian consumers are very sensitive to oil price) and has a lower maintenance costs than hydrocarbon-fuel-powered vehicles. CNG vehicles are encouraged by governments in Asia due to high pollution in these countries.
vi) Export of LNG is already on its way with the US sanctioning two LNG export terminals and another 12 waiting for approval. On 17 May 2013, the US Energy Department announced that it has conditionally authorized Freeport LNG Expansion, L.P. and FLNG Liquefaction, LLC (Freeport) to export domestically produced liquefied natural gas (LNG) to countries that do not have a Free Trade Agreement (FTA) with the United States from the Freeport LNG Terminal on Quintana Island, Texas. Freeport previously received approval to export LNG from its facility to FTA countries in February 2011. In May 2011, Cheniere Energy’s Sabine Pass, in Louisiana, was the first LNG terminal to get authorization to export LNG to non-FTA countries. Freeport’s and Cheniere’s combined capacity would amount to 5.2% of US production. As of 17 April 2013, 12 new LNG export terminals have been proposed in the US to Federal Energy Regulatory Commission (FERC) and there are currently 63 LNG export terminals planned or under construction worldwide.
7) Discount to peers: Apache has proved reserves of 2.9 billion barrels of oil equivalent (BOE) and is currently producing 779,000 BOE per day. This is in line with Anadarko (APC), its closest competitor. APC trades at an EV/EBITDA of 7.1x, price to tangible book of 2.1x and a forward P/E of of 16.1x as compared to APA’s multiples of 3.8x, 1.1x and 9.1x, respectively (see table below). APA’s stock price would have to increase approximately by 80% to trade at APC’s multiple.
| Comp Valuation | ||||||
| Ticker | Price | Market cap | P/tangible book | P/OCF | Forward P/E | EV/EBITDA |
| APA | 85.04 | 34,017 | 1.13 | 4.00 | 9.1 | 3.79 |
| APC | 86.71 | 43,360 | 2.08 | 5.24 | 16.1 | 7.14 |
| under value | 46% | 24% | 43% | 47% | ||
| DVN | 55.3 | 22,050 | 1.47 | 4.54 | 10.57 | 6.14 |
| under value | 23% | 12% | 14% | 38% | ||
8) Valuation: Despite taking heavy write-offs on various natural gas assets last year due to lower natural gas prices and increasing its debt to finance acquisitions, Apache’s trades at price to tangible book of just 1.1x (tangible book value per share of USD 77). This is historically low, even lower than 2008 levels. Also, on a price to EBITDA (P/EBITDA: 2.73x) and price to OCF (P/OCF: 3.9x) basis its trading close to or below 2008 levels.
9) Peak in capex: Capex (excluding acquisitions) has doubled from its 5 year average. It has risen from a 5 year average of USD 4.7bn to USD 9.5bn in FY12 and is still growing. As the company is investing significantly in capex to extract value from the recently acquired assets, capital expenditure will peak out in 1-2 years resulting in significant increases in production. Also, reduction in capex in the future will significantly increase free cash flow.
Risks:
i) Supply demand: As per International Energy Agency (IEA) report, for the period 2012-2018, world liquid capacity would grow by 8.4 million barrels per day, significantly faster than demand, which is projected to grow by 6.9 million barrels per day. This could depress liquid prices on the downside.
ii) Revenues heavily dependent on oil: Approximately 78% of APA’s total revenues come from oil.
iii) Selling oil at Brent price: Approximately 72% of APA’s crude oil production is priced relative to Brent crudes and sweet crude from the Gulf Coast, which continue to be priced at a significant premium to West Texas Intermediate (WTI)-based prices.
iv) Transportation: 71% of the oil consumption in the US is from transportation. In next 3-10 years fuel efficient hybrids, LNG, CNG and electric cars might be more common than we expect and the dynamics of oil industry could change significantly.
v) Environmental concerns: Fracking is relatively young, and probably not all of the environmental and geological consequences are fully understood. As time goes by, it is reasonable to expect more government regulations, which inevitably increases costs and could even put smaller producers out of the business.
vi) Egypt: Threats in Egypt include deterioration in the political, economic, and social conditions or changes in laws or regulations in the region, export restrictions, nationalization of APA assets and/or forced renegotiation or modification of existing contracts.
Hedge: For the above first 4 reasons, it is better to buy the stock with a hedge, downside protection to Brent oil. This makes sense especially now, as Brent is trading at 105, due to risks in Syria and Egypt.
Conclusion: In last 2 days stock has gone up by 3%. It is advisable to buy on dips. Market is neglecting APA’s diversified asset base and attractive long-term production growth in its asset rich shale plays and paying too much attention on Egypt, short term results and increased capex spending. Recent strategic acquisitions have huge potential still to be capitalized with room to improve margins and an enormous optionality on natural gas upside. The stock is significantly undervalued as compared to its peers and is trading below 2008 levels on valuation basis. Decline in oil price is a concern, by hedging the same one can bet on relative-value and a natural gas upside.
Company description: Apache Corporation, an independent energy company, explores for, develops, and produces natural gas, crude oil, and natural gas liquids. It holds interests in asset base of 12.3 million gross acres located in the United States; 7 million gross acres in Canada; 9.7 million gross acres in Western Desert, Egypt; 30 exploration permits, 17 production licenses, and 13 retention leases that cover a total area of 7.9 million gross acres in offshore Western Australia; 32 concessions, exploration permits, and other interests covering an area of 4.4 million gross acres located in 4 hydrocarbon basins in Argentina; and various properties located in the United Kingdom North Sea.
As of 31 December 2012, it had total estimated proved reserves of 1,441 million barrels of crude oil, condensate, and natural gas liquids; and 8.5 trillion cubic feet of natural gas. Combining both, Apache has proved reserves of 2.9 billion barrels of oil equivalent (BOE), and the company is currently producing about 779,000 BOE per day. However, including its Permian/Central resources that number goes up to 11.7 billion barrels of oil, four times higher than the current proved reserves. The company was founded in 1954 and is based in Houston, Texas.
Disclosure: Long APA, short Brent oil (via DTO)
Disclaimer: It is very important to read the disclaimer before making any investments based on the above article.
The Fake New Normal
Everything is great, keep the party going!
Europe: European problems are far from over. It is sinking in deeper recession with unemployment in 17 country Euro-zone at historically high levels of 12.1% and increasing. Retail sales dropped 0.1% in March from a 0.3% slide the previous month. Unemployment in Spain is now up 27.2% and mortgage delinquencies are continually rising. Portugal is moving toward a second bailout. Its government is considering to pay public workers in Treasury bills instead of cash. It also plans to slash 30,000 public sector jobs as a part of spending cuts. France’s business survey shows that it could enter recession (see chart below). Germany is faltering too with car sales in March down 12% y-o-y. While Slovenia’s creditworthiness is deteriorating as investors speculate a banking crisis in the region (see charts below). Banks in Slovenia are significantly undercapitalised with toxic loans now standing at 18% of GDP. All that said, Spain’s 10-year yield dropped to 3.8% for the first time since October 2010, yields on two-year Italian notes fell below 1% for the first time on record and 10 year Portugal bond yields dropped to 5.5.%, least since October 2010. This was after the ECB cut its main refinancing rate on 2 May and signaled it was open to a negative deposit rate. Conclusion: deteriorating fundamentals but significantly lower yields. Welcome to Matrix!

source: zerohedge

source: zerohedge
The US: It is not just Europe, the US macro economic data hasn’t been strong as well. 1Q13 GDP missed expectations and came in at 2.5%. Excluding inventory it would be at 1.6%, a very anemic growth. The total of ISM manufacturing and non-manufacturing index declined by 4.1% and 1.8%, sequentially, in March and April 2013. Construction spending tumbled 1.7% in April to a seven month low. Housing market index for the month of April was down. Thomson/Reuters Small Business Lending Index showed small businesses reduced their borrowing for a fourth month in a row and delinquencies on outstanding loan balances rose for the first time in more than three years. The ADP employment report indicated that the US economy added just 119,000 private-sector jobs in April, which was below consensus expectations of 155,000. People employed as a % of total civilian population (the real gauge of employment) in April was at 58.6%, pretty much same as in 2012 and just a little improvement from its historical low of 58.2% in July 2011. Most of the US macro economic data hasn’t met expectations but the market has ignored all of that and has only gone in one direction: north. Below is the chart showing the disconnect between economic data expectations (Bloomberg Economic Surprise Index) and S&P.

Source: zerohedge

Consumer Spending Fundamentals: Y-o-y growth in personal income has also been very anemic and below inflation, with y-t-d 2013 monthly average of 2.5%. Savings as a % of personal disposable income is currently at 2.7%, below 3% is a warning signal. With low income growth and already low savings rate, consumer spending, the engine of the US economy, doesn’t have a lot of room to run. Above all, q-o-q percentage change of personal income excluding current transfers is at recession levels (see chart 3 below). Also, the effect of tax increases (payroll and other taxes) comes at a lag and might be seen in the coming quarters. Lastly, people have forgotten about sequestration as if it never happened. Its impact has yet to begin.

 Source: zerohedge

Source: zerohedge
Sales growth and Margin expansion: Macro US data and Europe doesn’t matter, ultimately what matters are earnings and companies are beating expectations. Europe has been this way for a long time and market has understood to ignore it. Earnings is what market cares and companies have been beating expectations.
This is what the bulls argue. It is true, however companies have been beating only bottom-line by low-balling expectations. They have been missing on top-line. Sales growth is declining as the base is already high and the economy is growing at a slow pace. Sales growth is down from 9% levels in 2011 due to a very low base in 2010, to just 4% levels in 2012. So far in 1Q13, more than 50% of the S&P companies have reported earnings with more than 57% missing revenue estimates.
Also, corporate margins are at historic highs. Margins are mean-reverting and cannot keep going higher. S&P operating margins peaked at 9.5% (highest in last 13 year) in June 2012 and were at 8.0% in December 2012. The US corporates are the leanest historically and there is not much to squeeze to increase margins. Also, a lot of debt has been refinanced at super low rates reducing the interest cost which is one of the reasons for high margins. Conclusion: slowing sales growth and not enough left to squeeze to increase margins doesn’t sound like a good profitability recipe.

Source: zerohedge

Source: zerohedge
Current market P/E: market probably not that cheap: But markets are cheap, so all the above doesn’t matter as long we can buy good quality stocks for cheap.
Nothing is cheap in this market. March ending ttm earnings expectation for S&P are: as reported earnings: 88.06 (y-o-y inc of -0.5%), operating earnings: 98.78 (y-o-y inc of 0.7%). At these levels we have
Price to sales: 3 May 2013: 1.48; 31 Dec 2007: 1.43
PE (as reported earnings): 3 May 2013: 18.33; 31 Dec 2007: 17.36 (historical long term average is approximately 15.5x)
Price to book: 3 May 2013: 2.42; 31 Dec 2007: 2.77
All these ratios are above historical averages and equivalent to 2007 peak showing that the market is overvalued.
Flaw in S&P earnings estimate calculation: It doesn’t matter, future earnings expectations are high. Also, on a forward basis (FY13) market is cheap, trading at only 15x PE (reported earnings).
For FY13, analysts are expecting, as per S&P (as of 29 April 2013), a 14.2% increase in operating earnings to USD 110.5 and a 24.3% increase in as reported earnings to USD 107.6 (see graph below) (historical long-term earnings cagr is 4.8%). Considering the high sales base and end of productivity gains, I think, this is an optimistic view which makes S&P vulnerable. However, the main catch is how these forward earnings are calculated. This article on Seeking Alpha beautifully describes the mismatch between actual and expected earnings. The main difference is the pension expense. The crux being actual operating earnings are calculated by a different analyst which includes pension expense as a normal expenditure while estimates are calculated by another group of analysts which excludes pension expense while calculating operating earnings, as they consider pension expense an “unusual item”. This makes the expected earnings look inflated. So if the market is trading at high valuations (S&P already up 10.5% YTD, in just 4 months) based on expected earnings which are already inflated and the economic data is getting worse, probably it may not be a pretty scene. Conclusion: investing when it looks the easiest is at its hardest.

All the other asset classes and markets: While S&P keeps going in a straight line at 45 degrees, MSCI emerging market index is down, Europe is down, CRM commodity index is down, copper and steel has had a significant move down, personal income growth in the US is below inflation and banks are planning more job cuts. The market is conveniently ignoring all that. Apart from foreign risks (Europe’s debt crisis, Japan’s reflationary commitment, etc), the current overvalued market has a risk of rising interest rates, stopping of quantitative easing, reversing of historically high margins and probability of missing high earnings expectations.

source: zerohedge
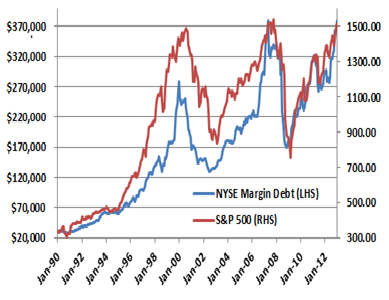
Who is buying?: Recent article by WSJ, Bond Funds Running Low on…Bonds, points out that the number of bond funds owning stocks is at its highest point in 18 years, showing that if bonds are in a bubble, equity is a place to go, even if that’s not their expertise. A sign that typically conservative investors are taking bigger risks to boost returns via dividend paying stocks. A clear consequence of money printing and significantly low interest rates, not benefiting masses at large instead making markets vulnerable. The other class of buyers is traders as no one wants to miss the rally. This has resulted in equity crowded trade. The below graph shows NYSE margin debt, which is at its all time high. Last two highs were in 2000 and 2007, when market peaked. If market falls, margin calls would be all over and the drop could be precipitous.
Japan: Who else is buying? The Japanese? The historically biggest Japanese quantitative easing is resulting in flight to safety from Japanese investors, who sense that their own bond market is on the verge of breaking down. This has managed to send French and Belgian bonds to record lows, the Spanish 2 Year to sub 2%, the German 6 month bill negative in the primary market, the US 10 year below 1.8% and 30 year sub 3%. Also, the yield-hungry-safety-looking Japanese are buying the US equities contributing to overvaluation and the fundamental disconnect. The immediate result is that the bond-equity disengage continues to diverge. Is this a new normal? If yes, it is not healthy and can’t go on for a long time.
FED support: Lets, for a minute, assumes how the economy would look if FED support is taken off. Excess liquidity goes away, interest rates rise and stocks fall. So the economy is still on FED crutches and an overvaluation in such a scenario only shows irrational exuberance. Assuming that the consequence of money printing is just positive is naïve. Also, assuming that a slow withdrawal of money printing would be smooth and easy is an irrational thought. No one has been able to do it, the Germans, the Japanese, the Argentinians etc have all failed. We have seen countries stuck in the liquidity trap and unable to exit but never there is an instance when a country exited smoothly without any pain. The question now is that if 5 years of massive QEs cannot revive the economy, what can? Also, if the market falls, people will start doubting the effectiveness of QE.
The incomplete cycle: Lastly market operates in cycles. A common saying is that get your companies right and don’t worry about Mr. Market. He will have mood swings but eventually you will be rewarded for picking up the right companies. They forgot to mention the price. Price is everything. Equity market can be dead for more than a decade and make you extremely rich in another decade. The concept of market cycles has been proved historically era after era. Below table shows 16 year market cycles from 1886 until present. The current cycle looks incomplete with a positive return instead of a negative cagr.
 Most people fail to recognize that absence of immediate crisis doesn’t mean that we won’t eventually face one and that the consequence of money printing isn’t just positive. In a global central bank money printing environment where economic fundamentals don’t matter, VIX at a complacently low level of below 13, major continents in recession and earnings based on overly optimistic future expectations, I guess one should think twice before investing. What we know for certain is that during the most recent market cycle, the repeated hope that stocks could detach from the economic data proved to be unfounded in nearly every instance: 2010s fall in May and June, 2011s fall in August and September and 2012s fall in May and June. When debt to central bankers or economists doesn’t matter: debt growing from USD 6 trillion to USD 16 trillion in past 12 years, it is time to take a step back and think.
Disclosure: long S&P put spreads
Disclaimer: It is very important to read the disclaimer before making any investments based on the above article.
End of a superpower: Japan’s next decade
Long: CDS on Japan or Out-of-the-money put options (or put spreads) on Japanese interest rate swaps
Trading at: 1 year CDS: 55bps 5 year CDS: 126bps 10 year CDS: 164bps
Upside: Best case: 509% to 966% (cagr of 44% to 81%) Base case: 335% to 611% (cagr of 23% to 39%) Worst case: 238% to 433% (cagr of 15% to 23%)
Time period: 5 years to 7 years
Understanding Japan:
In 2011, Japan was the third largest economy in the world after the United States and China. Japanese economy grew at an average rate of 7.5% in 1960’s and 1970’s (aka Japanese post-war economic miracle) and 3.2% in 1980’s and early 1990’s before the burst of its real estate bubble. Until 1990’s, before the Japanese property and stock market crash, Japanese households saved and businesses borrowed. When there were not enough borrowers for the available savings the economy would weaken and Bank of Japan (BOJ) would lower the interest rates. When there were too many borrowers, the economy would overheat and interest rates were raised. The end result in either case was that savings were borrowed and spent, which resulted in growth. When the Japanese stock and real estate market collapsed in 1990’s, asset prices plunged while debt was still on the corporate balance sheets. The fear resulted in deleveraging by the corporate world. This led to a significant decrease in borrowing and hence slow growth regardless how far BOJ lowered interest rates, creating a surplus of private savings. To reverse the situation and to stimulate spending, BOJ borrowed those surplus private savings and started spending in the form of stimulus. It’s been borrowing and spending since then, which has inflated BOJ’s debt to very high levels and has resulted in 2 lost decades of economic growth.
What fuels Japanese Government Bonds (JGB’s):
Large savings by the household sector and corporate Japan have fueled the JGB market. As of 2010, financial assets held by household sector (1,488tr Yen) and corporate Japan (454tr Yen) were 1,942tr Yen, while liabilities of the same were (361tr and 854tr Yen, respectively) 1,215tr Yen.4 These savings, directly or indirectly, are invested in the JGB market via Japanese banks. This has been the reason that Japan has been able to sustain huge levels of debt by borrowing 95% internally.
Fuel from corporate Japan: The below graph (chart 1) shows that cash and deposits held by all industries in Japan has remained pretty much stable but the investment in securities by corporate Japan has increased consistently and notably in last few years (until recently), fuelling the JGB market. Corporate Japan has been increasing its annual investment in securities by an average of 10.2tr Yen in last 5 years and 8.8tr Yen in last 10 years.
Chart 1

Household savings: Japanese household still (as of 2010) have a savings rate of approximately 35%, which is approximately 73tr Yen on a yearly basis. A lot of this money flows into Japanese banks in the form of savings account or deposits which help fuel JGB’s.
Japanese banks having fewer options: Over the past decade, a gradual increase in deposits and a decline in corporate loans (chart 1) have provided additional space for investments in JGB’s. Since 2000, household deposits have increased while demand for bank loans (short and long term, chart 1) by corporate have declined. These two factors have led to a decline in the loan-deposit ratio from 95% in 2000 to 70% in 2011 for Japanese banks. More deposits in banks and fewer options to invest have resulted in significant increase in their JGB holdings.4
Intervention by Bank of Japan (BOJ): BOJ has increased purchases of JGB’s (currently at 21.6tr Yen per year on a gross basis) since the beginning of the global financial crisis. It has been acquiring government securities through the new asset purchase program, which has resulted in stable yields. 4
That being said, Japan issued 40tr Yen in 2011 and 44tr Yen in 2010. Adding corporate Japan investments in securities and Japanese household savings gives us 83tr Yen (73tr Yen + 10tr Yen, as mentioned above) on a yearly basis of which some flows into JGB’s. Assuming that BOJ keeps intervening in the JGB market and buying JGB’s through the asset purchase program, (which I don’t think is possible for a very long period of time) still approximately 25%, 21tr Yen (25% of 83 = 21), of the corporate and household savings should be directed to JGB market for it to sustain itself. Household savings (approximately 90% of the total 83tr Yen) are expected to decrease due to aging population while the issuances of JGB’s are expected to increase due to increased expenditure related to aging population and the debt service cost. I have researched thoroughly and have done an in-depth analysis to understand if the next decade could be the end of a once superpower reaching the Keynesian end-point.
Fundamental problems of Japan:
Quantitative issues:
Fiscal deficit:
Japan is spending more than twice of what its earning (chart 2). As of 2011, its yearly expenditures were 212% of its revenues. The below graph shows that the fiscal deficit is only getting worse due to declining revenues and increasing expenditures, both of which are a factor of Japan’s aging population and negative population growth.
Chart 2

Table 1

Social security and debt service costs: Japan is financing these fiscal deficits by issuing Japanese Government Bonds (JGB’s). It has been trying to cut its spending but is unable to curb its social security and debt service expenditures, which are a major component (28% and 20%, respectively) of its total expenditures (see table 2. I have excluded year 2011 in compounded annual growth rate calculation due to earthquake and tsunami in Japan, which is a one-time event and has resulted in increased government expenditures for 2011). These expenses will only increase and get worse as Japan’s 65+ age group has grown exponentially and is highest as a percentage of its population in the world. In addition, in 2007 Japan’s population growth rate turned negative. In next 5 years population of age group 65 years and above will increase from approximately 23% of its total population in 2010 to an estimated 27.5% by 2015. As modeled, this can increase the annual social security expenditures by an estimated 70% by 2018. Such high social security costs along with declining revenues would make it difficult for Japan to handle its fiscal deficit.
Table 2

Debt levels and interest rate:
As previously mentioned, when the Japanese stock and real estate market collapsed in 1990’s, asset prices plunged while debt was still on corporate balance sheets. The fear resulted in deleveraging by corporate world. This resulted in significant decrease in borrowing regardless how far BOJ lowered interest rates, creating a surplus of private savings. To reverse the situation and to stimulate spending, BOJ borrowed those surplus private savings and started spending in the form of stimulus. It’s been borrowing and spending since then, which has inflated BOJ’s debt to very high levels. Japan’s debt as a percentage of revenues has increased from 3.4x in 1990 to 19x as of 2011, a very high leverage (chart 3). This will only get worse in the future as the revenues are declining while the expenses are going up, adding to the overall debt.
Chart 3

Japan has been able to sustain this by borrowing internally from its people and corporations. Domestic buyers hold about 95% of the nation’s debt, according to the Japanese Ministry of Finance. Even though the country’s debt has increased significantly after the burst of the 1990 bubble, interest rate on its debt has gone down drastically. Interest rate on JGB’s has reduced from 5.5% in 1990 to 1% as of 2011 because of low growth (0% to 1%) and zero interest rate policy (chart 4). With such low interest rates, interest payments on JGB’s are 20% of its revenues. Besides, as mentioned above its debt to revenue was at 19x as of 2011. As modeled, it can reach to approximately 28x by 2018. At such high levels a small change in interest rate could increase the interest payments considerably. In addition, given the high correlation between yields on JGB’s and other sovereign debts, a sudden rise in global risk premia could have a spillover effect on the JGB market. In 2011, with a leverage of 19x, implied interest rate on JGB’s increased by 20 bps to 1.1% which resulted in an increase in interest expense by 27%. Interest expense increased to 20% of revenues in 2011 from 14% in 2010 with just a 20 bps move in rates (as of Sep 2011 interest expense was 10% of revenues for the US with an implied interest rate of 2.9% on its total debt). If the interest rate on JGB was to rise to 2%, interest payments could reach as much as 53% of the revenues and debt service 75% of revenues by 2018, virtually making Japan broke. Most of its revenues would just go to service its debt and for all its other expenses such as social security, education, defense, public works, energy, local allocation, etc (which presently account for 80% of its total expenditures and are growing) it would have to issue more debt. The question is would the interest rate on JGB increase?
Chart 4

Increase in redemption of long term JGB’s, increasing reliance on short term debt: There is way more issuance of JGB’s than its redemptions (all bought internally) which lets Japan fund its deficits and keeps it going. The interest rates would increase if the demand for JGB’s decline or there is more redemption than issuance. This hapenned during the financial crisis sometime in April 2009. The demand for JGB’s dropped significantly and so did the issuance while the redemptions were increasing (chart 5). Though this was short lived but chart 6 shows the appetite for long term JGB is declining.
Chart 5

Chart 6

In addition, the recent trend shows that Japan is now increasingly relying on short term debt (chart 7). This is definitely not healthy and shows a decrease in appetite for long term JGB’s. Banks have been shortening the maturities of their JGB holdings. An increase in market volatility could further push banks to shorten the maturity of their JGB holdings or reduce their JGB exposures to limit losses. This could further reduce the demand for long term JGB’s increasing the reliance on short term debt.
Chart 7

Qualitative issues
Demographics, aging population:
Japan’s population age 65 years and above has grown exponentially and is highest as a percentage of its total population in the world. Its birth rate has fallen significantly over the years and is the second lowest in the world after Germany. Besides, the birth rate is now lower than its death rate. This means negative population growth along with an exponentially aging population, which is a recipe for disaster. This can have following consequences:
i. As more population continues to age and the population declines the dependency on work force would increase. As of 2010, the dependence of elderly on working population (ratio of 20-60 age group / 60+) was 1.7, down from 2.4 in 2000. As modeled, it may reach to 1.4 by 2015.
ii. Aging population means more pressure on government in terms of higher social security and medical expenses.
iii. Aging population means more pressure on corporate due to more pension outflow. A lot of pension funds in Japan hold JGB’s. They are now selling them to pay for growing number of retirees. This trend may continue putting pressure on JGB’s.
iv. The household sector has been financing more than half of JGB’s either directly or indirectly through banks and other financial intermediaries. Private savings will keep declining and probably at an increasing pace due to aging population as the elderly don’t save, they utilize the savings, which would mean less fuel to fund JGB’s.
Social Security in Japan:
It is very important to understand Japan’s social security system as it’s a growing expense and is the major component (28% as of 2011) of its total expenditure. Social security schemes in Japan adopt the social insurance system. Look at the below table. It gives you a broad overview of the social security system in Japan.
Table 3
Social Security Schemes in Japan

Source: Social Security in Japan, 2011 by Shuzo Nishimura of National Institute of Population and Social Security Research
As you can see in the table above, five (public pension, health insurance, long-term care insurance, employment insurance, and work-related accident insurance) main social insurance schemes are financed through social insurance, rest are financed by tax revenues. The social insurance premium on these five are shared by all insured according to their ability to pay (income). That said, tax revenues are also used to subsidize social insurance systems. Below is the breakdown of the Social security revenues and expenditures.
Table 4

Source: Social Security in Japan, 2011 by Shuzo Nishimura of National Institute of Population and Social Security Research and National Institute of Population and Social Security Research (IPSS), “The Cost of Social Security in Japan 2008”
Of the five schemes financed through social insurance (Public Pension, Health Insurance, Long-term care insurance, Employee insurance, and work-related accident insurance….see table 3), all citizens are enrolled in the Public Pension and Health Insurance Schemes. It is important to understand Public Pension and Health Insurance as they are the major component 67% (42% and 25%, respectively) of the total social security expenditures. Also, increasing aging population (social security expenditure on elderly is 56%) makes it even more vital to understand and analyze public pension and health insurance in Japan. Below is the analysis of public pension and health insurance schemes.
Health insurance:
Overview: Japan’s medical services are financed through a public mandatory health insurance system, which is composed of three types of schemes: occupation-based (Employees’ Health Insurance, approximately 70 million individuals covered in this scheme as of March 2009), region-based for those who are below 75 years (National Health Insurance, approximately 36 million individuals are covered in this scheme as of March 2009), and a separate health insurance for population aged 75 years and over (Health insurance for elderly, approximately 5.7 million individuals are covered in this scheme as of March 2009). These public health insurances provide universal coverage to the entire population. All insured persons receive the same medical service at equal price. Also, healthcare providers cannot refuse treatment to a patient without reasonable cause as the General Practitioner system is not implemented in Japan. A patient can be treated directly at a hospital as an outpatient.
Financing: The public health insurance schemes are financed by insurance premiums (49.2% of total financing in 2007), subsidy from the general budget of the government (36.7% of total financing in 2007), and co-payment from patients (14.1% of total financing in 2007). For the Employees’ Health Insurance, the premium is a fixed percentage of employee’s salary, which is shared equally by the employers and the employees. For the National Health Insurance, the premium differs among insurers and is usually levied on the basis of income, property, and number of insured within a household.
Rising healthcare cost for the elderly: With the aging population the share of the health care costs for the elderly in total medical costs has increased. Japan has been implementing a series of reforms to reduce costs. The reforms from 2002 to 2006 raised the co-payment rate for both old and young (above school age and below 69) for all medical insurance systems to 30%. The co-payment for the elderly aged between 70 and 74 was again raised in 2006 from 10% to 20% and for those elderly with high income to 30%. In addition, in 2008 government made a change in the system which required the elderly aged 75 or over to pay a premium and a 10% co-payment. It also introduced a scheme to share the burden of medical costs for the elderly with other public medical insurers.
Present co-payments structure:
Elderly aged 75 or over: 10% (revised once)
High-income elderly aged between 70 and 74: 30% (revised twice)
Non high-income elderly aged between 70 and 74: 20% (revised twice)
Below school age: 20% (revised once)
Rest all: 30% (revised twice)
Even with all these measures the aging population continues to accelerate and medical expenses for the elderly haven’t declined. The share of public health expenditure among the total public expenditure has increased from 11.7% in 1980 to 25% in 2009. Government is running out of bullets to keep its rising healthcare cost for the elderly under control. Also, we are seeing a high default rate in National Health Insurance scheme as that provides medical service coverage to all individuals except for employees. Therefore the subscribers include a relatively larger number of people with higher income risk or medical payment risk.
Public Pension:
Japan’s public pension is 42% of the total social security expenditure. Japan has three-tiers of pension system: first tier is the Basic Pension which provides a flat rate (not based on income) basic pension for universal coverage. It aims to provide a basic income guarantee for the old age, and the participation is mandatory to all residents. The coverage of the Basic Pension is universal, i.e. it is intended to cover all residents 20 years old or above in Japan including foreigners. The Basic Pension for the self-employed, farmers and other non-employed is called the National Pension.
Statistics of Basic/National pension: 105 million of population above the age of 20 ( 128 million of total population), 65 million subscribers, 25 million current pension recipients, 38% default rate, Yen 54,000 of average monthly benefits, starting age of 65
Source: Social Security in Japan, 2011 by Shuzo Nishimura of National Institute of Population and Social Security Research
Growing number of eligible and required persons who have not paid the premium in full is one the biggest problems of the National Pension (table 5). The collection rate of premiums is at a historically low level. The ratio of monthly premiums actually paid to that suppose to be received was down to 60% in 2009 from 86% in 1992. Government has taken various measures to fix this problem but the default rate has only increased in the years.
Table 5

Source: Increasing National Pension Premium Defaulters and Dropouts in Japan by Wataru Suzuki of Gakushuin University , Tokyo, Japan and Yanfei Zhou of Japan Institute for Labour Policy and Training, Tokyo, Japan.
High default rates along with declining premiums and increasing pension costs due to aging population has just added to this problem. Various reforms to restrain the payments, including cutting back of future benefits, raising premiums and raising the pensionable age from 60 to 65 have been implemented but nothing has worked.
Pension for corporate employees: The second tier, Employees’ Pension, covers most of the employees and is income-related in both premium and the benefit structure. Its provision is mandatory to all firms over a certain size, and premium is shared by employers and employees.
Statistics of Employees’ pension: 35 million subscribers, 24 million current pension recipients, 1.3% default rate, Yen 155,000 of average monthly benefits, starting age of 65
Source: Social Security in Japan, 2011 by Shuzo Nishimura of National Institute of Population and Social Security Research
In line with the introduction of international accounting standards in 2000, corporate pension schemes underwent a major reform. The Employees’ Pension Fund was streamlined, and instead, Defined-Benefit Corporate Pension (2001) and Defined Contribution Plan (2002) were established. The principal reason for the introduction of these schemes was to accurately reflect a firm’s outstanding pension liabilities on the financial statements.
Many corporations have and are trying to shift from the Defined-benefit (DB) pension to the Defined Contribution (DC) pension. This is because firms are realizing a huge burden of future pension payments which is now labeled as liabilities under the new accounting system. Suffering from low-returns on their funds, firms want to convert their DB pension schemes to DC schemes, in which future payments are related to the performance/return of funds, as opposed to the current system in which future payments are fixed. That said, number of people enrolled in DB are still approximately twice that of the DC.
Pension funds: Rapid aging, low rate of economic growth, and near-zero interest rates have made it difficult for the National Pension (first tier) and the Employees’ Pension Insurance (second tier) to secure enough funds to meet the increasing pension costs due to aging population. With this frustration recently we have seen pension funds (all pension funds, first and the second tier, are managed by government), who are one of the biggest holders of Japanese debt (hold 13.3% of total JGB’s as of September 2011), selling JGB’s to pay pensions for growing number of retirees (chart 8 and 9). This trend will continue as the population ages and age group 65 years and older increases as a percentage of total population. This could be a potential threat to the JGB market as increased selling of JGB’s by pension funds could reduce the demand and increase the supply of JGB’s in the market, putting pressure on JGB yields.
Chart 8

Source: Ministry of finance, Japan
Chart 9

Source: Bank of Japan, SG Cross Asset Research, Zerohedge.com
Other risks to JGB market
Other than the fundamental problems of massive debt, huge fiscal deficit, high social security, health care and medical costs, and aging population the JGB market also faces some other risks which could reduce the demand for JGB’s.
Household surpluses reducing with the aging population: The household sector has been financing more than half of JGBs either directly or indirectly through banks and other financial intermediaries. With the population aging this is likely to reduce. Household savings may decline in the future and gross public debt could exceed household financial assets in around 10 years. At that stage Japan may need turn to other sectors, including overseas, to finance its deficit.4
Demand from corporate might decline: In the near term, demand from the corporate sector could also decline. Corporate financial surpluses are an important source of JGB funds and have been fuelling the JGB market directly or indirectly via banks. After the global financial crisis, these surpluses rose sharply as corporates’ postponed investments and put a ceiling on wages. These surpluses could decline if corporates’ invest in capital expenditures domestically or abroad. This could very well be the case given the strong Yen and shrinking domestic market. Overseas M&A activity by Japanese firms have increased significantly to a record 3tr Yen in the first half of 2011.4 Corporate surpluses flowing out of country would mean lesser demand for JGB’s.
Pension funds: As discussed above, pension funds, holding about 13.3% of total JGB’s as of September 2011, are selling JGB’s to pay pensions for growing number of retirees (chart 8 and 9). This trend will continue as the population ages and the age group 65 years and older increases as a percentage of total population, putting pressure on JGB.
Risk appetite: Increase in risk appetite of households could result in savings flowing in risk assets such as stocks and corporate bonds than in JGB’s. Also, since the financial crisis of 2008 Japanese banks have increased their JGB holdings significantly (banks hold approximately 44.3% of total LT JGB’s as of June 2011 as compared to 39.6% as of Dec 2007) 2 amid flight to safety. An increase in risk appetite of banks would result in shift from JGB’s to other assets. As mentioned, this can be exuberated by an increase in demand for corporate loans by Japanese corporations for investments abroad. This would result in money flowing in corporate loans than in JGB’s, reducing the demand for JGB’s.
Interest rate risk: As mentioned above, Japanese banks have increased JGB’s in their portfolio amid flight to safety. With banks JGB holdings rising to more than 15% of their assets, they now face interest rate risk. Increase in interest rate would result in decrease in bond prices and hence capital losses. A 100 basis point increase in interest rates across all maturities would generate capital losses of around 500bn Yen at the major banks and about 400bn Yen at the regional banks as of FY2010 according to the BOJ. This is equivalent to 10% of major banks’ tier 1 capital and more than 30% of regional banks’ tier 1 capital, respectively.8 Banks may offload some of their JGB holdings to reduce their interest rate exposure.
Perception of safe haven: So far JGB market is perceived to be safe. A change in perception due to extremely high debt levels or volatility in JGB yields could result in a sell-off and hence increase in yields. All banks have the same risk management system and hence usually the sell-off is all at the same time pushing down prices further. The VaR shock of June 2003 resulted in tripling of 10-year JGB yields in over three months to 1.6% from 0.5%.
Rise in JGB volatility: As mentioned above, major Japanese banks have been shortening the maturities of their JGB holdings to an average of about 2 years in FY2010 (from 3.2 years in 2002–03) in response to higher interest rate risk (chart 7).4 Increase in interest rate volatility could result in banks further decreasing their exposure to longer term JGB’s and further shortening the maturities of their JGB holdings.
Ratings downgrade: In August 2011, Moody’s lowered Japan’s credit rating by one notch to Aa3. Though ratings downgrade hasn’t affected JGB yields, a further and consecutive ratings downgrade may induce banks to reduce their JGB holdings.
JGB auctions: A series of weak JGB auctions may push up yields.
Rollover risk: Japan faces a lot of rollover risk on JGB’s as approximately 80% of its short term debt as a percentage of the total debt and 13% of its long term debt as a percentage of the total debt (total 93% of its debt) on average is rolled over on a yearly basis. Such huge rollovers pose risk and a small disruption in the supply and demand of JGB’s could dislocate the smooth absorption of new issuances and push up JGB yields. For example, the “FILP shock” of 1998 resulted in yields spike up due to confusion over the purchases of JGB’s by the Fiscal Investment and Loan Program (FILP) Special Account.
Global Spillovers: Global financial distress could have negative spillover effects on the JGB market through the banking system. So far the European turmoil hasn’t affected the JGB market. JGB yields, along with the U.S. and Germany, declined during the recent European sovereign crisis due perception of safehaven. However, if sovereign distress spreads more globally, it could raise the risk premium on JGB’s. Another channel for global spillover could be through the derivatives markets where foreign participation is high. Despite low foreign ownership of JGB’s (5% of the total outstanding), foreign investors are active in the JGB futures market, holding about 33% of outstanding contracts. Compared to domestic players, foreign investors are also more sensitive to Japanese sovereign risk, as indicated by the rise in spreads on JGB CDS. Any distress sell-offs in the futures market could affect the JGB cash market through arbitrage.4
Chart 10

Source: IMF working paper, Assessing the Risks to the Japanese Government Bond (JGB) Market December 2011
Will Japan be able to pay its debt? How strong is Japan’s balance sheet?
So now that we have analyzed the income statement of Japan and its qualitative and quantitative problems, lets analyze its balance sheet. As of November 2011, Bank of Japan (BOJ), Japan’s central bank, had a balance sheet of 143tr Yen (USD 1.8tr) (FED’s balance sheet is approximately USD 2.5tr). An important point to note is that 64% of BOJ’s assets are JGB. This shows that BOJ has been doing quantitative easing (buying its own bonds) to fund its deficits. With 64% of its assets as JGB, if the value of JGB falls BOJ is in trouble. It would need to print more money to further fund its deficits. In addition, only 4% of its assets, 5.8tr Yen, are Gold, cash and foreign currency assets as compared to current deposits of 32tr Yen (22%), repos of 23tr Yen (16%) and bank notes of 79tr Yen (55%) on the liability side. That’s definitely not a strong balance sheet for any central bank.
Conclusion:
From 1995 to 2000, 2000 to 2005 and 2005 to 2010 Japan’s total revenues grew at a compounded annual growth rate (CAGR) of 0.4%, –0.9% and 0.2%, respectively and its debt by 10.8%, 9.6% and 2.6%, respectively. Declining revenues due to aging population and increasing debt due to growing fiscal deficit, with revenue to debt multiples of approximately 19x is just unsustainable. Super low interest rates, extremely high debt, huge fiscal deficits and risks mentioned above makes Japan vulnerable. A small increase in interest rates could potentially increase the expenditures significantly resulting in worsening the fiscal imbalance and making Japan broke. With fiscal situation worsening the probability of this is high as the interest rates have to increase by just 30bps – 50bps for the market to panic and interest expense to increase by 100% to 40% of revenues by 2018.
For last 5 years the Italian 10 year government bonds have been yielding in the range of 4% to 5%. After the Greek crisis Italian bond yields increased a 100 bps and they were perceived as risky. Its strange how a 100 bps can make a difference in perception and could change the story completely. For Japan it could be even less.
In the 15th century, Debt of Florence in Italy increased significantly from 50,000 to 5 million to finance the war. The question was who was lending to them? It was their own people. All this money was raised internally. Citizens were obliged to lend money to the government in return of which they received government bonds which paid interest. These government bonds were liquid and could be bought and sold as and when required. This way Florence remained solvent and the people were happy to receive interest on bonds and/or trade them as found appropriate. With excessive increase in debt supply, people doubted government’s ability to pay back its debt. Between 1509 and 1529 these bonds were trading at 10% of the face value.
Market is not always efficient; it over reacts to news, sometimes fails to analyze cooked books, legal language and at times doesn’t anticipate the obvious. You will always find opportunities if you dig in deep. If it was efficient, nobody would have profit from it.
– Suneet Chandvani
Sources:
1) Bank of Japan http://www.stat-search.boj.or.jp/
2) Ministry of Finance, Japan http://www.mof.go.jp/english/
3) Ministry of Finance, Japan (debt management) http://www.mof.go.jp/english/jgbs/debt_management/plan/e20111224overview.pdf
4) The Statistics Bureau and the Director-General for Policy Planning of Japan http://www.stat.go.jp/english/
5) IMF working paper, Assessing the Risks to the Japanese Government Bond (JGB) Market December 2011, prepared by Waikei Raphael Lam and Kiichi Tokuoka http://www.imf.org/external/pubs/ft/wp/2011/wp11292.pdf
6) Social Security in Japan, 2011 by Shuzo Nishimura of National Institute of Population and Social Security Research
http://www.ipss.go.jp/s-info/e/Jasos2011/SS2011.pdf
7) Source: Increasing National Pension Premium Defaulters and Dropouts in Japan by Wataru Suzuki of Gakushuin University , Tokyo, Japan and Yanfei Zhou of Japan Institute for Labour Policy and Training, Tokyo, Japan.
8) SG Cross Asset Research and ZeroHedge http://www.zerohedge.com/article/dylan-grice-what-weimar-republic-popular-delusions-can-teach-us-about-japans-upcoming-hyperi
9) The IMF’s Global Financial Stability Report (October 2010) and the Bank of Japan’s Financial System Report (September 2010).
Disclosure: No positions, neither do I intend to take any positions in next 5 working days.
Disclaimer: It is very important to read the disclaimer before making any investments based on the above article.
Revisiting Polyplex: extremely attractive valuations
Long: Polyplex equity listed in NSE (National Stock Exchange of India) (Ticker:POLYPLEX)
Trading at: 160 Rupees (as of 6 Jan 2012)
Upside: Best case: 240% (compounded annual return of 36% to 84%) Base case: 96% (compounded annual return of 18% to 40%) Worst case: 31% (compounded annual return of 7% to 14.5%)
Time period: 2 years to 4 years
Table 1
Investment thesis:
Polyplex is trading at extremely attractive valuations. As of 6 January 2012, the stock was trading close to its 52 week low with valuation ratios of 0.22x its tangible book value, 1.3x its price to ttm EPS (P/E), 0.45x its enterprise value to ttm EBITDA, 0.64x its price to ttm EBITDA and 1.5x its price to ttm free cash flow. All these numbers are adjusted and normalized to exclude any onetime, non cash and/or non operating items. With such low valuations the upside is huge. The industry P/E is 3.68x with Uflex and Jindal Poly films, the main competitors of Polyplex, trading at P/E multiples of 3.2x and 1.7x and P/B multiples of 0.7x and 0.5x, respectively. Though the entire industry is trading at very low multiples, Polyplex looks extremely attractive on the basis of its valuation and growth. A tangible book value of 0.5x or a P/E of 3x can easily double to triple the stock price from here. The return on investment can be anywhere between 50% and 200% in 1 to 4 years, with a yearly dividend yield of approximately 4%-4.5%.
Company description, business and industry overview, future projects and growth, risks, profitability, liquidity and management are discussed below and a detailed valuation model is attached.
VALUATION MODEL (click on the link and then click on download)
Company description:
Listed in NSE (National Stock Exchange of India) (POLYPLEX) Polyplex Corporation Ltd. together with its subsidiaries (Polyplex/company) is a global manufacturer and supplier of high performance plastic films (PET, BOPP & CPP) mainly used in the flexible packaging industry. The company has manufacturing plants in India, Thailand, Turkey and the US, apart from distribution channels in the US and China. It is the fourth largest producer of thin Polyester (PET) films. The company is also backward integrated to produce captive raw material for PET films. Polyplex has been paying dividend every year since 1993.
Source: Polyplex Corporation Ltd.’s 2010-2011 annual report
Business and industry overview:
Polyplex’s business is focused on producing high performance plastic films (plain and metalized…thick and thin), technically known as BOPET (Biaxially-oriented polyethylene terephthalate). BOPET is mainly segmented into Thin & Thick Films:
i) Thin Film: 50 Micron & Under (75% of total BOPET market)
ii) Thick Film: Over 50 Micron (25% of total BOPET market)

Source: June 2011 SET opportunity day presentation by Polyplex (Thailand) Public Limited Company

Source: June 2011 SET opportunity day presentation by Polyplex (Thailand) Public Limited Company
BOPET thin film is mainly used in the flexible packaging industry. Flexible packaging is the main market/segment of Polyplex and comprises of 81% of its total sales as of FY2011 (rest is 18% industrial and 1% electrical, both mainly being thick film applications).
Better packaging not only improves the shelf life of the products but is also essential for improving product appeal in a highly competitive consumer goods industry. Flexible packaging also reduces the cost of packaging as compared to the conventional packaging. This has resulted in shift from rigid forms of packaging to flexible packaging which has ensured higher-than-GDP growth rates in this industry across the globe. World demand for BOPET films (thick and thin) is expected to grow by 8.7% p.a. to 2015 and flexible packaging industry growth is estimated at 9% as per PCI films consulting Ltd and Polyplex estimates. PET film, being a higher-end substrate within packaging, has been among the faster growing substrates. An increase in the purchasing power in the developing countries has brought with it a large rise in the per capita consumption of packaging material. As a result, Asia (excluding Japan & Korea), is the largest market for PET films with 41% of the PET films produced being consumed in this region. However, per capita consumption of packaging material in developing countries is still very low as compared to the mature markets, which should help in sustaining the growth rates. The changing demographics of faster growing younger population and urbanization are also contributing to the growth in developing countries. The other drivers of demand and growth in these regions are the increase in the share of organized sector in consumer products and retailing, small serve packs arising out of need for inclusive and rural marketing, increasing consumerism and the resulting need for better packaging.
81% of the company’s products are used in food and consumer goods markets such as packaged foods. Demand for packaging is quite inelastic when it comes to food products, household goods and personal care products etc., which are to a large extent non-discretionary in nature insulating the industry from the global economic recessionary environment. For example, during recessionary period of 2008-2009 and 2009-2010 the top line growth of the company did not decline, though the margins contracted. This is taking into consideration that the company generates approximately 30% of its revenues in North America and 25% in Europe, where recession was most severe. Below are the numbers (fiscal year ending March).
Table 2

The demand for these products is also expected to grow in the future with better standard of living, increasing population, and increased longevity, especially in the emerging economies.
Products manufactured by the company also have electrical and industrial applications (19% of its total sales as of FY2011) and are used in solar power cells, touch-screen panels of mobile phones and flat screen televisions and some parts used in automobiles. Electrical/ electronic segment has maintained its pace of growth due to the demand from flat panel display screens used in LCDs and electronic displays. Films used for solar applications like photovoltaic (PV) products have also shown buoyancy in demand in the recent past. These products are in growth stage and hence demand would remain consistent with decent growth rates and room for expansion. OLED, which utilizes thin film plastic and is in its R&D phase, is the future for screens http://www.youtube.com/watch?v=NcAm3KihFho .
Similar to the shift in demand, the supply-side dynamics have also changed. Most of the new capacities are being added in low-cost developing countries, primarily in Asia. Most of this new capacity is also focused on the packaging segment, with an emphasis on high productivity and low operating costs. This has adversely impacted traditionally large producers of PET film operating with high cost structures, especially in developed economies. These producers are now emphasizing on developing niche technologies in PET films like films for LCDs, solar panels and specific high-end applications within packaging. While trade defense measures like anti-dumping, import duties and countervailing duties have been in use for the last two decades, they are unable to address the inherent problems of low-productivity assets/machines operating in the developed countries producing films for traditional applications. No new thin film line has been setup in the US or EU since 2003 until 2010 (the company has recently set one up which will begin operations in 2012) increasing the import intensity in these regions. Also, diversion of capacity by several large producers from packaging to industrial segment by conversion of thin film lines into intermediate and thick films along with closure of some old lines have added to the supply problem.
Out of the total new capacity added in the last 5 years, 56% has been added in China itself, which is significantly higher than the accretion in demand there. Since large exports from China are still not visible, it has resulted in below-average operating rates there. Operating rates in developed countries in the western world also tend to be lower than the average due to competitive market position (approximately 75%). On the other hand, most of the new assets in the rest of Asia would be operating at above average operating rates (approximately 90%) because of newer, better and efficient machinery used. Companies with better quality, access to international customers and a better supply chain model stand a better chance of emerging as winners.
India is one of the largest and fastest growing markets in the world for flexible packaging. The drivers for growth in India are similar to those of other developing countries with additional consumption coming from the widespread usage of small-serve packs due to its large lower income population. The thin PET film market in India is estimated about 230,000 tons for 2010-2011. However the ban imposed by Government of India on sales of gutkha (chewing tobacco) in plastic sachets in February 2011 has had a significant impact on demand for thin PET films in India. Estimates range between 25%-30% of the Indian market-size could be affected. Polyplex generates 20% of its revenues from India. A 25% reduction in size of the existing PET film market in India due to ban of gutkha would only impact the company’s revenues by approximately 5%. That said, the growth in the region is still above par. Considering the large market base and the expected annual growth rate of about 12%, the company estimates that 25%-30% of the additional global demand shall originate in India making it an attractive market. The total capacity of the industry in India is about 400,000 tons, with the surplus production generally being exported to other regions.
Source: Polyplex Corporation Ltd.’s 2010-2011 annual report and June 2011 SET opportunity day presentation by Polyplex (Thailand) Public Limited Co.
Strategy:
For years the company has been following the below strategies which has helped it grow significantly.
1) Manufacturing or distribution presence in the key regional markets for an efficient delivery model, backward integration and providing better access to the global markets. The company has a large international presence with active sales in 87 countries across the world. It has plants in key locations such as India (to serve the Indian market), Thailand (to serve the South East Asian market), Turkey (to serve the European market), and the USA (to serve the North American market). It produces its own raw materials in all its plant location resulting in lower cost and better control of quality and availability. It also has strong global delivery capabilities with near-shoring and efficient onward distribution network. Acquisition of a distribution company in the USA in early 2006 has been a strategic move of the company in this direction. Setting up of a trading company in China in FY 2009-10 is another strategic decision to establish the company’s presence in one of the largest and fastest growing markets for its products. The company is also evaluating similar initiatives in other key regional markets like Latin America and Africa where its presence is limited.
2) Operating in tax free zones. Most of the company’s manufacturing units, in all countries in which it operates, are strategically located in tax free zones. Average tax paid by the company in 2010-11, 2009-10 and 2008-09 was 5.6%, 12.2% and 7.1% respectively. Its average tax rate for last 12 quarters is approximately 10%. The low tax rate makes them very competitive in terms of pricing their products and helps them maintain good margins. With the same strategy, the company has set up a new manufacturing facility in Decatur, Alabama, USA in 2011. According to a local news service, state and local government of Alabama have waived more than approximately USD 11m in taxes.
3) State of art manufacturing facilities and machines to lower cost per unit. State of art manufacturing facilities along with high capacity utilization rates of more than 90% has helped the company to price its products at competitive rates and maintain healthy margins. The company has been setting up these manufacturing facilities in its key locations (India in 2009, Thailand in 2010 and 2011, the USA in 2011) to take advantage of the inherent problems of low-productivity assets / machines operating in the developed countries by PET film manufacturers. In continuation with this strategy, Polyplex is currently setting up a plant in the US which would be operational by September 2012 with sophisticated machines and state of the art manufacturing facilities. As per plasticnews.com, established U.S. plants, some of which operate with a 15- to 20-year-old machinery, may face problems to regain manufacturing parity with Polyplex as its entering the US market with latest machines of 30,000-ton, 8-meter-wide [line], running at 400-500 meters a minute. Recently they have also entered a joint venture with a Japanese firm which has better technology to further reduce their costs.
4) Diversification of product offering. In the recent past, the company also has ventured into downstream businesses like silicone coating, extrusion coating and diversification into BOPP and CPP films, enabling it to offer a more complete package to the industry.
Future projects under implementation and capital investments by the company and its subsidiaries:
1) Thin PET film line, PET chips plant & metallizer in Alabama, USA
2) Improvements in manufacturing facilities in India
3) Thick PET film line & PET chips plant in Rayong, Thailand
4) Silicon coating line in Rayong, Thailand
5) Blown PP line in Rayong, Thailand
6) Thermal lamination line in Rayong, Thailand
All the above projects are described below:
1. Setting up of a new manufacturing plant in the US: Polyplex has set up a new manufacturing facility (PET film line, PET chips plant and metallizer) in Decatur, Alabama, USA with an estimated capital investment of USD 185m (Phase 1: USD 110m and Phase 2: USD 75m). The tentative completion is in September 2012. The plant has been set up primarily for two reasons: to overcome the trade defense measures like anti-dumping, import duties and countervailing duties in the US and to take advantage of the inherent problems of low-productivity assets / machines operating in the developed countries by PET film manufacturers. As per plasticnews.com, established U.S. plants, some of which operate with a 15- to 20-year-old machinery, may face problems to regain manufacturing parity with Polyplex as its entering the US market with latest machines of 30,000-ton, 8-meter-wide [line], running at 400-500 meters a minute. Another reason is that the traditional large producers are now emphasizing emerging niche technologies in PET films like films for LCDs, solar panels and specific high-end applications within packaging. Due to this we have seen diversion of capacity by several large producers from packaging to industrial segment by conversion of thin film lines into intermediate and thick films along with closure of some old lines. This has added to the supply problem. In addition, no new thin film line has been setup in the US or EU since 2003 until 2010, increasing the import intensity in these regions.
The facility has been set-up with backward and forward integration to reduce cost. As per plasticnews.com, the plant has been strategically located at Decatur, AL as facilities of BP Chemical and Indorama in and around Decatur would help a stable supply of resin and chemicals such as paraxylene. In addition, as per the news service, Polyplex plans to work with local partners to build on-site feedstock resin plant. Once operational, this plant will ensure faster deliveries and a reliable onshore supply chain solution to the existing and potential customers in Americas, which is approx 29% of the company’s market. According to a local news service, state and local government of Alabama have waived more than USD 11m in taxes for setting up a plant in the region.
2. Converting PET film line into specialty film line in India: The company is converting its first PET film line at Khatima plant in India into specialty film line with a capital investment of around Rupees 6,835 lacs (USD 15.3m). The modification of this line will facilitate the broad basing and diversification of product portfolio in India. The project is expected to start commercial production in December 2011. In addition in July 2011 the company added another metallizer at Bazpur plant in India with a capital investment of around Rupees 1,650 lacs (USD 3.7m). It is also debottlenecking and modernizing all its plants in India.
3. Thick polyester film project in Thailand: The company is in the process of setting up a thick film line and a Batch process chips plant (Polyester Resin Plant) with capacities of 28,800 MT and 23,500 MT, respectively in Thailand with a capital investment of Rupees 33,435 lacs (USD 75m) including working capital. This will enable the company to expand its product range to include thicker, more functional and specialty films strengthening its offering in industrial applications, where products are more differentiated and customized. This would help diversify sales into industrial and optical end use segments including new uses in Photovoltaic (PV) industry. Further thick film also offers a relatively higher margin and more stable business thereby mitigating the risk of volatility in earnings. The plant is expected to start commercial production by end of March 2013.
4. Silicone coating, Blown PP and Thermal lamination line in Thailand: Polyplex is currently implementing a silicone coating line (which will use PET film as an input, i.e. backward integration) in Thailand at an estimated capital expenditure of Rupees 10,274 lacs (USD 23m) as a push for forward integration and specialty and value added products. The work for the line was completed in June 2011 and the commercial start up is anticipated by January 2012. This is a high capacity line with capability of making silicon coated products for the entire spectrum of end-use and will help capture the high growth siliconised film market. The company would also add a Blow PP line in Thailand in 2012 which would enhance usage of this silicone coating line besides adding another end use segment of Peel & Stick liner in the product range.
Along with the above projects the board has approved a thin PET film line, PET chips plant and metallizer in Brazil. The company is undertaking these projects as it sees demand for its products in the future and room for expansion. Once functional, these new plants would not only increase the top-line but also depreciation, resulting in lower tax and increased free cash flow.
On completion of the ongoing / approved projects the total manufacturing capacities will increase by approximately 23%. Below is the table:
Table 3

Total market and market share of Polyplex:
The company is presently serving only 10% of the global flexible packaging industry (estimated to be 1545 KMT as of 2011) and even with all the above expansions, by the end of 2012, it is expected to serve approximately 11% of the industry (expected to be 1698 KMT by 2012). It not only has the potential to grow with the growing industry rate of 9%-10% but also to capture the market share by using the same strategies it has been using before.
Table 4

Profitability:
The company’s latest filing is as of 30 September 2011. The table below gives a glance of the company’s top-line growth and EBITDA margins.
Table 5

The above numbers depict the strong revenue growth, profitability and EBITDA margins. That said, in recent quarters the company has seen very high growth rates due to supply shortages. This might not be the case in the future. On a conservative basis, I have modeled a revenue growth of -5% and 10% for FY 2011-2012 and 2012-2013, respectively. Also, Polyplex may face margin pressures as a lot of companies in this industry have recently invested in adding capacities. This might negatively impact the industry margins and hence the profitability. Again, on a conservative basis, I have modeled high raw material costs and a low EBITDA margin of 18%, as compared to an average EBITDA margin of 29% in FY 2011. With these assumptions Polyplex is trading at a price to future EPS of 1.65x and 1.5x and a price to tangible book value of 0.2x and 0.18x for FY 2011-12 and 2012-13, respectively, making it extremely cheap. As of 30 September 2011 it had more 85% more cash on its balance sheet than its market cap. One has to keep in mind that in a year or two, once the above projects are operational, they can add significantly to the revenues (more than what I have modeled, I like to be a little conservative in my modeling) as the manufacturing capacities will increase by approximately 23%. Increased revenues with extremely low valuations make the stock very attractive with huge upside. A P/E of 3 or a book value of 1 can double to 5 times the stock price from here.
Management:
Promoters and promoter group shareholding (non-encumbered) as of the latest quarter ending 30 September 2011 was approximately 47%. Promoters have maintained their large shareholding showing their confidence in the company. Management understands the business pretty well and has consistently and opportunistically added plants in strategic locations to maximize profits and efficiencies. They have grown net fixed assets by 5x to approximately 17bn Rupees (USD 340m) in last 7 years by reinvesting cash in the company. EBITDA has increased by approximately 6.6x during that period.
Cash and liquidity position:
As of 30 September 2011, company’s cash position increased significantly by 767% to Rupees 9.8bn (USD 196m). This was mainly due to a gain of Rupees 6.37bn (USD 127m) on sale of 8% stake in March 2011 and 11% in November 2010 in one of its subsidiary companies (Polyplex Thailand Public Company Ltd. (PTL)). With this sale, the consolidated holding of Polyplex Group in PTL has reached 51.0%. The company is using this money for the projects mentioned above. Excluding the sale cash position increased by 209% on a Y-o-Y basis to approximately Rupees 3.5bn (USD 70m). As of 30 September 2011, company had a leverage of 1x, net leverage of -0.2x and interest coverage of 32.7x. It generated a free cash flow of Rupees 3.4bn (USD 69m, 14% of sales) for FY 2010-2011. Huge cash position along with strong free cash flows and large unutilized credit lines shall be quite adequate for the company in any kind of stress situation and gives it financial flexibility to take advantage of any opportunities in the future.
Other positives:
1) Appreciation of Yuan can make Chinese exports of PET films expensive, which may benefit Polyplex. As mentioned above, the company has manufacturing or distribution presence in the key regional markets for an efficient delivery model and to mitigate foreign exchange and export trade risk.
2) With technology out there to recycle plastic, it will only get better and more efficient.
3) Use of plastic will never go away. Its been growing and will keep growing in the future. A lot of metal automobile parts are now been replaced by plastic in ever growing efforts to reduce costs due to lower consumer spending in the developed world.
Reason for low valuations:
1) The Indian stock market can be trader driven, as a lot of stock markets around the world are. Recently traders have been driving stock prices lower, irrespective of company’s valuations.
2) As in any market, valuations can remain distorted. So is the case in the Indian markets. A lot of companies are trading at a significant discount from their 52 week highs due to global concerns, the US debt and its fiscal deficit, PIIGS overall and Greek debt in specific, Chinese economy slowing down, etc.
3) For some reason I have noticed that the Indian market just values (or puts more emphasis on) the stand-alone company/results and not consolidated. This doesn’t make sense to me as I always look at the company on a consolidated basis and also analyze its subsidiaries. My guess is that the Indian market is just valuing the Indian company as a stand-alone not giving weight to the point that the Indian company is the holding company and has 51% stake in its main subsidiary Polyplex Thailand Ltd (PTL).
Risks:
1) A lot of companies in this industry have generated huge cash reserves, which are reinvested in adding capacities. If demand doesn’t increase in the way that the companies are expecting, we might see overcapacity and hence ample supply in a few years, which could result in decline in prices and margins. The company expects global PET film growth rates to range between 7-10% in the years 2011-15, with demand in Asia growing faster at between 10-12%. From the spate of announcements and lines on order with the machine vendors, it is very clear that the overall capacity addition during 2011 to 2013 is expected to be much higher than the growth in demand. High capacity additions in anticipation of future growth would create periods of high competition and result in lower margins. This is the main concern in the industry. In short to medium term there is a likelihood of excess supply due to new capacities being added while the growth in demand would be linear resulting in reduced margins.
2) One of the main raw materials for the company is crude oil. With crude prices very high company’s margins would shrink. That said, this is a common risk to the entire industry as the raw material price movement affects all industry participants.
3) A significant and sustained one-sided movement could result in substantial inventory gains or losses.
4) 80% of the company’s revenues are from overseas markets and approx 20% from India. To break it down, 29% from North America and 25% from Europe. As these developed markets are matured and these economies may experience a relatively stagnant or slow growth, the company may not experience a lot of demand from these countries, which is the major source of its revenue.
5) International trade in PET film has been subjected to trade defense measures for more than two decades through the imposition of anti-dumping duties or countervailing duties. Anti-dumping duty (AD) can be imposed on imports if the ex-factory prices of such imported products are proved to be lower than the local selling prices of the similar products in the export countries. The important markets adopting this measure are the EU and the US against several countries. Countervailing duty (CVD) can be imposed if the domestic government or government agency provides subsidy to the exporter. Such tariff measures result in increased prices, making it difficult to compete in those markets. In the last US Anti-dumping petition against producers of PET film from Thailand, China, Brazil and UAE, duties were imposed against China, UAE and Brazil in the range of 3.5% to 76.7%, but exports from Thailand were found to be not causing any harm to the US domestic industry. As previously mentioned, Polyplex has a manufacturing plant in Thailand. The company undertakes all safeguards to insulate against the risk arising out of anti-dumping actions and other trade barriers imposed by the importing countries. A geographically well-diversified manufacturing and distribution portfolio helps mitigate the adverse fall-out of any such actions. The company has also started a manufacturing facility in Alabama, USA to overcome this problem. That said, if such import duties or countervailing duties and/or anti-dumping policies are further levied on the countries in which the company has manufacturing plants, it can significantly impact the company’s revenues.
Mispricing in valuations:
The company is underestimating the fair value of its assets on its balance sheet as compared to the price it would get in the market. This is evident by reverse-calculating value of its subsidiaries. Before doing that calculation lets first list the subsidiaries of Polyplex Corporation, to understand its company structure. Polyplex has 4 manufacturing companies:
1) Polyplex Corporation, Ltd., India
2) Polyplex (Thailand) Public Company, Thailand (PTL)
3) Polyplex Europa Polyester Film Sanayi Ve Ticaret A. S.(Polyplex Europa).
4) Polyplex USA LLC (PU/Polyplex USA) USA
These manufacturing companies are where the value is since they have the main assets. Other than these manufacturing companies, Polyplex has 2 distribution centers in the US, (Polyplex Inc. USA), and in China (Polyplex Trading Co. Ltd. China).
Polyplex Corporation Ltd India, which is the holding company, had 70% stake (directly and/or through investment companies) in Polyplex (Thailand) Public Company, (PTL). PTL is the most important subsidiary of Polyplex Corporation as it has (directly and/or through investment companies) 100% stake in Polyplex Europa (manufacturing plant) and Polyplex USA LLC (manufacturing plant), 100% stake in the distribution company in China and 80% stake in the distribution company in the US. Below is the holdco opco structure.

Source: Polyplex Corporation Ltd.’s 2010-2011 annual report (fiscal year ending March)
In November 2010 and March 2011 Polyplex Corporation Ltd, India (the holding company) sold approximately 11% and 8% stake in PTL, respectively, for Rupees 6.37bn (USD 127m). With these sales the consolidated holding of Polyplex Corporation Ltd, India in PTL decreased from 70% to 51%. The value of this 51% stake in PTL as per the above sale price = (Rupees 6.37bn *51%) / 19% = Rupees 17.1bn (USD 342m). This should be the buying price or the market value of the remaining 51% holdings of subsidiaries, as per recent transactions. Adding tangible book value of Rupees 3.8bn (USD 76m) of the standalone company we get Rupees 20.9bn (17.1bn + 3.8bn). So this can be considered as the total market value of the holding company (Polyplex Corporation Ltd, India) as per the recent market transaction. This market value divided by no of shares outstanding gives a share price of Rupees 653 (208,982 / 319.80 = 653.48), the stock is trading at 160, a clear upside of 309%. A Rupee 7 yearly dividend (4.3% dividend yield) makes it even better.
Arbitrage between the subsidiary and the holding company:
Recently Polyplex was on the best 200 Asian companies under a billion list published by Forbes. Here is the link http://www.forbes.com/lists/2011/24/best-under-a-billion-11_land.html (page 15). The irony is that PTL, 51% of which is held by the parent company Polyplex Corporation Ltd, India, had sales of USD 384m and a market capitalization of USD 399m (P/E of 3.4x and Price to ttm sales of 1.04x) while its parent company in India had Sales of USD 512m and a market value of USD 95m (P/E of 0.5x and Price to ttm sales of 0.19x) unadjusted for any one time charges. This shows a clear arbitrage. Below is the table.
Table 6

Conclusion:
The market isn’t pricing Polyplex rightly. The market cap of the company is less than its cash on its balance sheet. Theoretically, at this price, you can buy the company for Rupees 5.2bn (USD 100m). Pay yourself a dividend of the entire money invested with the cash on the balance sheet of Rupees 9.9bn (USD 190m). The company will still have Rupees 4.8bn (USD 92m) left on its balance sheet, more than enough to meet its working capital requirements. With this basically you ended up owning the company for free. In the future years you can pay the entire free cash flow generated by the company to yourself as dividends. For FY 2011, the company generated a free cash flow of Rupees 3.4bn (USD 69m), 67% of the present market cap. Assuming that the free cash flow doesn’t grow and remains constant, you not only ended up owing the company for free but also have a return of 69% (69m/100m) of your total investment every year, if you end up buying the company at this price and pay the entire free cash flow to yourself as dividend. Not to forget, dividend in India is tax free.
Polyplex is trading at extremely attractive valuations and the down side is limited but the upside is huge (Table 1). That said, you can get stuck in the value trap for a long time. Consider this as a long term play. In short run the stock can go further down due to margin pressures and/or global market conditions. That would be the time to accumulate at even lower valuations. In a normal scenario with a P/E of 2.5x the upside can be approximately 70% to 100% in 2 years. A little higher multiple of 4 gives a return on investment of 200% in 2 years. In case of a bull run the industry multiples can expand and the company multiple can even reach 7 to 9, which was the case in early 2010. In that scenario the upside could be 400% to 500%.
Market is not always efficient; it over reacts to news, sometimes fails to analyze cooked books, legal language and at times doesn’t anticipate the obvious. You will always find opportunities if you dig in deep. If it was efficient, nobody would have profit from it.
– Suneet Chandvani
Notes:
1) Consolidated Financial Results include the results of the subsidiaries as described in the group structure (holco–opco structure) above.
2) All numbers, including but not limited to, EBITDA, Net income etc are adjusted to exclude any one time, non operational and/or non-cash charges and hence may not match as reported by the company.
3) It is very important to read the disclosure and disclaimer before making any investments based on the above article.
Disclosure: Long Polyplex Corporation Ltd. (Ticker:POLYPLEX, in National Stock Exchange of India a.k.a. NSE )
Disclaimer: It is very important to read the disclaimer before making any investments based on the above article.
Accuracy in prediction and the next safe haven (follow-up to my previous article)
On 14th July 2011 I wrote an article highlighting that the S&P is at its high and there is disconnect between the fundamental economy and the market. From 14th July 2011 until today, 23 August 2011, S&P is down 12.6%. If you had a put option on S&P, depending on the option maturity and the strike price, you could have made anywhere between 30% to 200% in a month or less. The implied volatility and price, both would have acted in favor of that option.
People were talking about 1500 on S&P (GS had a target of 1450 on S&P for the year end 2011). When everybody was bullish, I was bearish and pointed out disconnects in my previous article, by analyzing in-depth risks within the economy and globally. When people were talking about low P/E’s and attractive valuations, I wrote in my article that the US economy may enter recession soon and there might be another leg down. I have understood one thing; the street is in the business of making predictions based on the last quarterly and/or monthly and/or weekly data. Few people look at the trends and analyze different sets of data as a whole.
Situation in the US
Consumer in the US is still weak and is still deleveraging from the massive increase in credit (below is the chart). Along with the deleveraging process the population of the US is aging at a significant pace as compared to the working population. As per Census, the age group between 20-64 will grow by 5.4% from 2010 to 2020 and 4% from 2020 to 2030, while the population aged 65 and older will grow by 36% and 32% in the same years, respectively. Not to forget, to get the fiscal debt in place, government has already started cutting spending which would definitely have a negative impact on the economy. In addition, foreclosures are increasing at 2.5x than houses in foreclosures are being sold and the total inventory of 90+ days delinquent loans and loans in foreclosure, is 51.9x of monthly foreclosure sales. This ratio will increase, as more foreclosures are added to the inventory than they are sold. The super low interest rate hasn’t helped. Besides, still 30% of current loans that are making payments on time are at risk, as they have negative equity due to falling house prices. All this data was as of May 2011. These risks were analyzed in detail in my previous article.
All these factors have a negative impact on the economy slowing the growth. Programs like Cash for Clunkers, First Time Homebuyers Tax Credit along with inventory adjustments (refilling), and enormous stimulus (QE1 and QE2) didn’t help. All these programs have now ended. Imagine, if that didn’t do much, now we have spending cuts which will only make things worse.
I think, we will see depressing numbers on the job front in the coming months due to following reasons:
i) To cut spending, government is reducing its workforce. In 2011, until May, government has already downsized its work force by 188k, approx 80% of what it did in the entire calendar year of 2010. This figure is expected to go up to 400k by the end of the year.
ii)We have recently seen banks cutting jobs. BOA and UBS plan to cut jobs by 3500 each. GS has been reducing its workforce quietly. In the anticipation of the Euro debt problems and the US recession, the banks, which are most sensitive to these issues, would cut jobs even more.
iii) With the overall worries in the economy, small businesses, which create most of the jobs in the US, would also be skeptical in hiring and would again, face the same issue of tightened lending standards from banks with banks turning more cautious.
iv) Productivity has declined for straight two quarters. To maintain margins we might see some lay offs.
In addition, personal savings, as a percentage of personal disposable income, increased by 0.4% to 5.4% in June 2011. A 0.4% increase in savings rate can have a 1.2% decline in personal consumption. There is a possibility that the 1.3% increase in GDP for 2Q11 might be revised lower. Besides, weekly mortgage applications for new purchases are weakening further and the much anticipated Philly Fed survey dropped to -30.7, which is extremely bearish. Not to forget, the Europe contagion is spreading.
In 1996, Japan’s GDP growth was approx 4.4%. This was mainly due to government support in the form of fiscal stimulus worth 5% of GDP. Once that support was removed in 1997, Japanese economy experienced five consecutive quarters of negative growth. The recent fiscal stimulus in the US and UK was approx 10% of GDP.

The US is going through a slow growth and not liquidity or solvency crisis like peripheral Europe. Every country has its cycle. From 1980’s until 2000, the US had a strong growth and main reasons were right demographics, credit expansion, and hence increase in asset prices. All these factors have reversed and now we have excessive debt, high fiscal deficit, deleveraging by consumers, aging population and declining asset prices. The US situation is not out of hand and the fiscal deficit is solvable with right policies, cuts in spending and entitlements, and increase in taxes. The best thing would be to de-lever and let it go through its cycle. This might result in slow growth in years to come. That said, deleveraging and innovation, which always leads to new cycles, would make the country stronger again. (http://www.ted.com/talks/geoffrey_west_the_surprising_math_of_cities_and_corporations.html)
One has to understand that with ratings downgrade nothing has changed. In fact, treasury yields have moved even lower. Peoples’ thinking has changed, which is good, that the US can never be downgraded irrespective of its fiscal situation and debt.
Is everything priced in?
1) Market overeats to data. As previously mentioned, the data out of the US in the coming months might be depressing and markets might overreact to that, as that would confirm their belief that the US is heading towards a recession.
2) Markets are expecting some kind of QE3, if that doesn’t happen we might see a sell off.
3) Market is cautious about the European debt crisis but definitely hasn’t priced in a default/haircut. If that happens we could see a massive selloff.
4) So far markets have seen companies beating expectation. If that turns, even for a quarter, markets will panic and start selling assuming that the economy is now affecting the bottom line of companies.
5) It is very important to keep in mind that the mutual funds are all invested. With mutual fund cash levels at 3.4% as of June 2011, historically the lowest, if they start selling we can see a huge sell off.
Understanding Europe:
Understanding Europe is not difficult if you just look at the numbers. As per Eurostat, as of 31 March 2011: (debt and GDP growth rates are on a Y-o-Y basis as of 31 March 2011)
Greece’s debt to GDP was 150%, its debt is still growing at approx 10% and GDP is declining by approx 2.8%.
Italy’s debt to GDP was 120%, its debt is growing by approx 4% and GDP by approx 2.5%.
Ireland’s debt to GDP was 103%, its debt is growing by a whooping 28% and GDP is declining by approx 2%.
Portugal’s debt to GDP was 94%, its debt is growing by approx 14% and GDP by approx 1.8%.
Spain’s debt to GDP was 64%, its debt is growing by approx 17.5% and GDP by approx 1.7%.
France’s debt to GDP was 84%, its debt is growing by approx 7% and GDP by approx 2.8%.
Germany’s debt to GDP was 83%, recently its debt has grown by approx 17% (due to support extended to Greece) and GDP by approx 4.6%.
Are these numbers sustainable? Below is the table

Would there be a default / haircut or can it be avoided? What about Euro Bonds?
With funds in EFSF and ECB’s commitment, we have seen some buying of Spanish and Italian bonds. That said, they can’t do it for too long as the total consolidated debt of Ireland, Greece, Spain, Italy, and Portugal is approx Eur 3.2tr (71% of Germany and France’s GDP combined, excluding their own debt), as of 31 March 2011. The amount is too big for anyone to bail these countries out. Also, as mentioned above, debt of these countries is still growing at a significant pace. Its politically and financially not feasible for Germany and France to backstop all this debt as that would not only affect their financial health but can also cause social unrest in these countries. In last two quarters, 4Q10 and 1Q11, Germany’s debt has grown by 18% and 17% on a Y-o-Y basis, respectively, due to support extended to Greece.
The haircut on Greece is inevitable. Debt/GDP ratio of Greece is already at 150%. As of 31 March 2011, even with all those austerity measures, debt is increasing at 10% on a Y-o-Y basis. Austerity would only reduce country’s revenues and growth, which is evident in the GDP growth of negative 2.8%, as of 31 March 2011 on a Y-o-Y basis. Growing debt and negative GDP can never solve a country’s problem, irrespective of austerity measures taken. A simple math shows that the debt to GDP ratio will only increase. The problem of debt can’t be cured with more debt, be it public or private. Companies have tried it and even countries have tried it (example Japan). None of them have been successful in doing it. Japan now has a debt to GDP of 200% and still growing, declining population, almost no immigration, increasing aging population, and declining tax revenues. At least Japan has the ability to print its own money and issue its own debt and sell 95% of that in its own country. Greece can’t do that.
What about the idea of Euro bonds? Can that be done? That would be the biggest mistake. EU itself is a mistake as the countries in EU can’t print money and there is no mechanism for ensuring fiscal discipline. The basis of different currencies is its ability to get weaker or stronger depending on that country’s productivity, competitiveness and growth. That entire basis was removed with the formation of the EU. Imagine having a Euro bond. That would take away further liberty from countries in EU to issue debt, if and when they needed. Also, if you allow all countries in the Euro zone to get access to cheap capital at the expense of the strong EU countries by issuing Euro bonds, you basically give the weaker countries a free ride and they wouldn’t adhere to the austerity measures. Euro bond would be like a mortgage backed security (MBS), wich is pool of good and bad loans. Only in this case it would be a pool of good and bad countries. Every time a financially unstable country has a problem the financially stable country would bail it out. That way the financially stable country not only has to use its money to bail them out but also has to pay higher interest rate on its debt (now there is just one Euro bond, so all countries in EU pay the same interest rate) due to mistakes made by financially unstable country. I don’t know how long would that continue. A haircut is necessary, inevitable and healthy. If they avoid it, they would just delay the consequences.
Pushing Greece out of the EU could also be an option. This would solve the current problem of EU and would be a lesson to the other EU countries that fudging data, reporting wrong data (that’s how it all started), having huge deficit and fiscal imbalances could have serious consequences. That said, Greece being removed out of EU would also mean a default. Where would the Greek Euro denominated debt that banks/financial institutions/central banks hold go?
Understanding the consequences of haircut on the market
Approx USD 135bn of Greece debt matures between now and the end of 2013 and an additional USD 82 bn in 2014. They are planning to roll over this maturing debt held by banks and ECB. That would be considered as default or selective default by the credit rating agencies. If the credit agencies consider it as a default, the ECB and banks can’t hold them anymore. Even if they provide an exception to this rule, the ECB and banks can’t use the Greek debt as collateral. Also, if rating agencies consider it as a default, the banks and ECB have to write down that debt on their balance sheet.
We are talking about USD 493bn of total Greek debt. As per Eurostat, Debt to GDP of Greece as of 31 March 2011 was approx 150%. To bring it down to even 100% levels, Greece would need a hair cut of approx 50%. Even if we consider a hair cut of just 20%, we could see a hit of approx USD 99bn (493 *20% = 98.7) in the system. This is just the hair cut. A more important concern appears to be the threat of short-term liquidity as a result of the hair-cut. The biggest European banks receive an average of USD 64bn funding through the US money market. This flow would be the first to dry up in case of any crisis faced by the European banks, reducing the liquidity and fueling the crisis.
Also, the stronger banks in EU would cut back their lending to the weaker banks further exacerbating the process. Not to forget, this could lead to breach in covenants resulting in acceleration of debt and/or additional capital/collateral requirements.
The overall effect could be large and the big banks would feel the pain but would be able to handle it as they have trillions of dollars of assets. Also Greek debt is pretty well diversified and not one bank holds a lot. The maximum amount of exposure that a non Greek bank holds is Eur 6bn. Here is the list of estimated top 40 holders of Greek government debt. http://www.zerohedge.com/sites/default/files/images/user5/imageroot/draghi/Barclays%20Top%20Holders.jpg. It is the small banks having direct or indirect exposure to Greek debt, which might be in serious trouble.
Though this would be good for the system as it would be a clean-up of excessive debt, markets, as usual, would overreact and fall significantly. As mentioned, the repercussions would range from losses on balance sheets of European banks, CDS’s being triggered, breach of covenants, fall in global stock markets , drying up of liquidity and banks being conservative and hence reduction in lending resulting in slower growth. Also, market always overreacts due to short term traders and computer trading. If one thing triggers, the other follows and there is massive selling. Besides, they all use the same risk metrics and hence they all sell at the same time when the risk goes up.
Understanding the long term macro picture and spotting areas for long term investments
That would be the time to buy. Think about it, there is so much more money in the system now than it was a few years ago. Once there is a selloff, which would be global as the markets are interconnected, it would be an opportunity of the decade to buy, especially in the emerging markets. In some of these markets, some stocks are extremely cheap and market in general is trading at its 52 week low (I have been following Indian market on a very regular basis). The fall would further bring down the prices making them super attractive. If you logically think from a 3 to 5 year perspective, you would be investing in i) fundamentally good and less levered economies ii) growing at a good pace with strong and growing middle class population iii) with cheap valuations due to the fall in the global markets.
Once investors realize that the growth in the US and the Euro zone is stagnant or very timid, a lot of that money will start flowing to emerging economies driving up asset prices in those places. This is what exactly happened in Japan. After the Japanese crash, a lot of Japanese money moved to the US markets for a decade. This was because of low growth and ample liquidity; the same conditions which we are now seeing in the US. Japan’s stock of FDI since 2001 has nearly tripled, from ¥6 trillion to over ¥18 trillion. (Source: http://www.state.gov/p/eap/rls/reports/2009/125605.htm#fdinus ). That’s a compounded annual growth rate of approx 15% for 10 years. I think, these are the growth rates at which we will see money flowing to the emerging economies. Cheap valuations, good fundamentals, strong growth, and increase in inflow of money are simple ingredients to great returns, on a long term basis.
Safe investments with good returns (making a low risk 10% return)
The best thing would be to keep money on the sidelines and wait for the right opportunity. A very small amount can still be invested in some carefully analyzed, not overvalued, put options on the market. The downside would be small, as a small amount is invested, but if the market falls, the returns could be huge. To play safe one can buy emerging market government bonds and still get a good yields. 5 year Indian government bonds yield 8.3%. If you lever up 20% here and invest there you can easily get a yield of approx 10%. Lock-in period is approx 3 years. You can enter into a FX swap to hedge the currency risk. It is a pretty safe investment as Indian government is extremely conservative and will not default on its bond as that would collapse the entire economy. Nobody is talking about this, but I guess soon investors will. I don’t know about other emerging market government bonds as the only emerging market I follow is India.
The central banks efforts of trying to push up asset prices by artificial stimulus and quantitative easing have failed. Now they are using the same methods to protect financial institutions from losses. We will see how far they succeed in that.
Understanding the macro economy globally to understand the direction of the market, and then picking markets and securities (stock, bonds, derivatives, commodities, etc) would be the best way to play in these times.
Disclaimer: It is very important to read the disclaimer before making any investments based on the above article.
Disclosure: Investments in Indian markets
-Suneet Chandvani
Extremely attractive valuations: Polyplex
Company description:
Listed in NSE (National Stock Exchange of India) (Code:POLYPLEX) Polyplex Corporation Ltd. together with its subsidiaries (Polyplex / company) is a global supplier of plastic films used by flexible packaging and industrial products companies. The company has manufacturing plants in India, Thailand and Turkey apart from distribution setup in the US and China. It is the fourth largest producer of thin Polyester (PET) films. The company is also backward integrated to produce captive raw material for PET films. Polyplex has been paying dividend every year since 1993-94.
Source: Polyplex Corporation Ltd.’s annual report
Valuation:

Polyplex is trading at extremely attractive valuations. As of 10 June 2011, it was trading at 0.28x its book value, P/E of 1.48, EV/TTM EBITDA of 0.65, and Price / TTM EBITDA of 0.83. All these numbers are adjusted and normalized to exclude any onetime, non cash and/or non operating items. With such low valuations the upside is huge. A tangible book value of 1 or a P/E of 3 can easily double or triple the stock price from here. The return on investment can be anywhere between 50% to 200% in 1 to 4 years, with a yearly dividend yield of approx. 4%.
Business, industry growth and overview, future growth and projects, risks, profitability, liquidity and management are discussed below and a detailed valuation model is attached.
Business, industry growth and overview:
Polyplex’s business is focused on producing high performance plastic films (plain & metallized) which are mainly used in the flexible packaging industry. Better packaging not only improves the shelf life of the products but is also essential for improving product appeal in a highly competitive consumer goods industry. Flexible packaging also reduces the cost of packaging as compared to the conventional packaging. This has resulted in shift from rigid forms of packaging to flexible packaging which has ensured higher-than-GDP growth rates in this industry across the globe. PET film, being a higher-end substrate within packaging, has been among the faster growing substrates. An increase in the purchasing power in the developing countries has brought with it a large rise in the per capita consumption of packaging material. As a result, Asia (excluding Japan & Korea), is the largest market for PET films with 41% of the PET films produced being consumed in this region. However, per capita consumption of packaging material in developing countries is still very low as compared to the mature markets, which should help in sustaining the growth rates. The changing demographics of faster growing younger population and urbanization are also contributing to the growth in developing countries. The other drivers of demand growth in these regions are the increase in the share of organized sector in consumer products and retailing, small serve packs arising out of need for inclusive and rural marketing, increasing consumerism and the resulting need for better packaging.
Three-fourths of the company’s products are used in food and consumer goods markets such as packaged foods, solar power cells, touch-screen panels of mobile phones and flat screen televisions and some parts of automobile. Demand for packaging is quite inelastic when it comes to food products, household goods and personal care products etc., which are to a large extent non-discretionary in nature insulating the industry from the global economic recessionary environment. For example, during recessionary period of 2008-2009 and 2009-2010 the top line growth of the company did not decline, though the margins contracted. This is taking into consideration that the company generates approx. 20% of its revenues in North America and 30% in Europe, where recession hit the most. Below are the numbers (year ending March).

The demand for these products is also expected to grow in the future with better standard of living, increasing population, and increased longevity.
Also, electrical/ electronic segment of end-use has maintained its pace of growth due to the demand from flat panel display screens used in LCDs and electronic displays. Films used for solar applications like PV products have also shown buoyancy in demand in the recent past. These products are in growth stage and hence demand would remain consistent with decent growth rates and room for expansion. OLED, which utilizes thin film plastic, is the future for screens http://www.youtube.com/watch?v=NcAm3KihFho .
Similar to the shift in demand, the supply-side dynamics have also changed. Most of the new capacities are being added in low-cost developing countries, primarily in Asia. Most of this new capacity is also focused on the packaging segment, with an emphasis on high productivity and low operating costs. This has adversely impacted the traditionally large producers of PET film operating with high cost structures, especially in developed economies. These traditional large producers are now emphasizing emerging niche technologies in PET films like films for LCDs, solar panels and specific high-end applications within packaging. While trade defense measures like anti-dumping, import duties and countervailing duties have been in use for the last two decades, they are unable to address the inherent problems of low-productivity assets operating in the developed countries producing films for traditional applications. No new thin film line has been setup in the US or EU since 2003 increasing the import intensity in these regions. Also, diversion of capacity by several large producers from packaging to industrial segment by conversion of thin film lines into intermediate and thick films along with closure of some old lines have added to the supply problem.
Out of the total new capacity added in the last 5 years, 56% has been added in China itself, which is significantly higher than the accretion in demand there. Since large exports from China are still not visible, it has resulted in below-average operating rates there. Operating rates in developed countries in the western world also tend to be lower than the average due to competitive market position. On the other hand, most of the new assets in the rest of Asia would be operating at above average operating rates because of newer, better and efficient machinery used. Companies with better quality, access to international customers and a better supply chain model stand a better chance of emerging as winners.
India is one of the largest and fastest growing markets in the world for flexible packaging. The drivers for growth in India are similar to those of other developing countries with additional consumption coming from the widespread usage of small-serve packs due to its large lower income population. The thin PET film market in India is estimated about 228,000 tons for the year under review. Notwithstanding the somewhat flat growth during 2009, considering the large market base and the expected annual growth rate of about 15%, the company estimates that 25-30% of the additional global demand shall originate in India making it an attractive market. The total capacity of the company in India is about 360,000 tons, with the surplus production generally being exported to other regions.
Source: Polyplex Corporation Ltd.’s annual report
Growth and future projects:
Following Projects are under implementation by the subsidiaries of Polyplex:
1) Project: Thin PET Film Line, & Metallizer Location: Corlu, Turkey Status: Relocated to North America
2) Project: PET Chips Plant Location: Corlu, Turkey Status: Progressing satisfactorily
3) Project: Thick PET Film Line & PET Chips Plant Location: Rayong, Thailand Status: Progressing satisfactorily
4) Project: Silicon Coating Line Location: Rayong, Thailand Status: Start up in Q2, 2011-12 (i.e…June 2011). The project has an estimated outlay of USD 22 million. The company is implementing this project as a push for forward integration and specialty products. This is a high capacity line with capability of making products suitable for the entire spectrum of end-uses for silicon coated products.
Also, the board has approved a thin PET film line, PET chips plant and Metallizer in Brazil. The company is undertaking these projects as it sees demand for its products in the future and room for expansion. Also, new plants, once functional, would not only increase the top-line but also depreciation, resulting in lower tax rate and increased free cash flow.
Other positives:
1) The Company has a large international presence with active sales in 87 countries across the world. It has strong global delivery capabilities with near-shoring and efficient onward distribution network. Acquisition of the distribution company in the USA in early 2006 has been a strategic move of the company in this direction. The company has plants or distribution centers in China, India, Singapore, Thailand, Turkey, and the USA.
2) Appreciation of Yuan can make Chinese exports of PET films expensive, which may benefit Polyplex. As mentioned above, the company has manufacturing or distribution presence in the key regional markets for an efficient delivery model and to mitigate foreign exchange and export trade risk. 3) All manufacturing units of Polyplex, in all countries which they operate, are strategically located in tax free zones. Average tax paid by the company in 2011-10, 2009-10 and 2008-09 was 5.6%, 12.2% and 7.1% respectively. Its average tax rate for last 12 quarters is approx. 10%. The low tax rate makes them very competitive in terms of pricing their products and also helps maintain good margins.
4) With technology out there to recycle plastic back to petroleum, it will only get better and more efficient.
5) Use of plastic will never go away. Its been growing and will keep growing in the future. A lot of metal automobile parts are now replaced by plastic in ever growing efforts to reduce costs due to lower consumer spending.
Profitability:
The company’s latest filing is as of 31 March 2011. Below table gives you a glance of the company’s top-line Y-o-Y growth rates.

In recent quarters, the company has seen very high growth rates due to the supply concerns. This might not be the case in the future. On a conservative basis, I have modeled a revenue growth of -5% in 2011-2012. That said; once the above projects are fully functional in a year or two, they can add significantly to the revenues.
Polyplex may face margin pressures as a lot of companies in this industry have reinvested in adding capacities. This might negatively impact its profitability. Again, on a conservative basis, I have modeled a EBITDA margin of 18% in 2011-2012, from 31% in 2010-2011.
Management:
Promoters and promoter group shareholding (non-encumbered) as of the latest quarter (31 March 2011), was approx. 47%. Promoters have pretty much maintained their shareholding, which is significantly large, showing their confidence in the company. The management understands the business pretty well and has grown net fixed assets by 4.3x to approx. 15bn Rupees in last 7 years by reinvesting the cash generated by the company. EBITDA has increased approx. 5.9x during that period.
Cash position:
As of 31 March 2011, the company’s cash position increased significantly from Rupees 1.29bn to 8.6bn. This was mainly due to a gain of Rupees 6.37bn on sale of 8% stake in March 2011 and 11% in November 2010, in one of its subsidiary companies (Polyplex Thailand Public Company Ltd. (PTL)). With this sale, the consolidated holding of Polyplex Group in PTL has reached 51.0%. The company is using this money for the projects mentioned above. Excluding the sale, as of 31 March 2011, cash position increased by 72% on a Y-o-Y basis to approx Rupees 2.23bn. Besides, the total debt decreased by 15% to Rupees 7.28bn. Increase in cash position and decline in debt shows the strength of company’s earnings and its balance sheet.
Risks:
1) A lot of companies in this industry have generated huge cash reserves, which are reinvested in adding capacities. If demand doesn’t exceeds the way companies are expecting, we might see overcapacity and hence ample supply in a few years, which could result in decline in prices and margins.
2) One of the main raw materials for the company is crude oil. With crude prices very high, company’s margins would shrink. Oil prices have gone up significantly and are at USD 120 per barrel, as of 10 June 2011. Brent crude is now 25% more expensive than at the start of the year. That said, the raw material price movement is common for all participants of the industry.
3) 85% of the company’s revenues are from overseas markets and approx. 15% from India. To break it down, 20% of company’s revenues is from North America and 30% from EU. As these developed markets are matured and the economy in these countries may experience a relatively stagnant or slow growth, the company may not experience a lot of demand from these economies, which is the major source of its revenue. The company has to focus on emerging economies and technologies where its products can be used.
4) There are some concerns about state government in India banning Polythene bags. Also, Supreme Court in India has imposed ban on Poly packing of Gutka (chewing tobacco). That said, the company only has 17% of its revenues in India. These bans may affect only 20%-30% of its business in India, which at the most, would have a 3.5% to 5% affect on its total revenues (20%-30% of 17% = 3.5% to 5%).
5) International trade in PET film has been subjected to trade defense measures for more than two decades through the imposition of anti-dumping duties or countervailing duties. Anti-dumping duty (AD) can be imposed on imports if the ex-factory prices of such imported products are proved to be lower than the local selling prices of the similar products in the export countries. The important markets adopting this measure are the EU and the US against several countries. Countervailing duty (CVD) can be imposed if the domestic government or government agency provides subsidy to the exporter. Such tariff measures result in increased prices, making it difficult to compete in those markets. In the last US Anti-dumping petition against producers of PET film from Thailand, China, Brazil and UAE, duties were imposed against China, UAE and Brazil in the range of 3.5% to 76.7%, but exports from Thailand were found to be not causing any harm to the US domestic industry. This has lead to non-imposition of any special duties on exports from Thailand to USA. As mentioned above, the company has a manufacturing plant in Thailand. Exports from India are subject to AD and CVD duties, totaling to 6.4% – 36.4% in EU and 7.17% to 65.59% in the US, apart from the normal import duty rates. Polyplex’s exports from India to the US and EU are subject to AD and CVD duty rates of 8.6% in EU and 7.6% in the US. The company undertakes all safeguards to insulate against the risk arising out of anti-dumping actions and other trade barriers imposed by the importing countries. A geographically well-diversified manufacturing and distribution portfolio helps mitigate the adverse fall-out of any such actions. That said, if such import duties or countervailing duties and/or anti-dumping policies are further levied on the countries in which the company has manufacturing plants, it can significantly impact the company’s revenues.
Conclusion:
The valuations for Polyplex are low because of following reasons:
1) Indian stock market can be trader driven, as a lot of stock markets around the world are. Recently traders have been driving stock prices lower, irrespective of company’s valuations.
2) As in any market, valuations can remain distorted. So is the case in Indian markets. Presently a lot of companies are trading at a significant discount from its 52 week high due to global concerns…the US debt and its fiscal deficit, PIIGS overall and Greek debt in specific, Japan’s recovery from tsunami and its massive debt, Chinese economy slowing down, etc.
3) There are some concerns about state government in India banning Polythene bags. Also, Supreme Court in India has imposed ban on Poly packing of Gutka (chewing tobacco). That said, the company only has approx. 17% of its revenues in India. These bans may affect only 20%-30% of its business in India, which at the most, would have a 3.5% to 5% affect on its total revenues (20%-30% of 17% = 3.5% to 5%). This ban has been one of the reasons for its falling stock price in the Indian stock market. The market is mispricing this as it is not taking into consideration that 83%-85% of the company’s revenues are from countries outside of India.
If the management successfully implements the above 4 projects, revenues can increase significantly. Anticipation of increased revenues with extremely low valuations makes the stock very attractive with huge upside. Also, the company is underestimating the fair value of its assets on its balance sheet as compared to the price it would get in the market. This is evident by reverse calculating value of its subsidiaries. Before doing that calculation lets first list the subsidiaries of Polyplex Corporation, to understand its company structure. Polyplex has 3 manufacturing companies:
1) Polyplex Corporation, Ltd., India
2) Polyplex (Thailand) Public Company, Thailand (PTL)
3) Polyplex Europa Polyester Film Sanayi Ve Ticaret A. S.(Polyplex Europa).
These manufacturing companies are where the value is as they have the main assets. Other than these manufacturing companies, Polyplex has 2
distribution centers in the US, (Polyplex Inc. USA), and in China (Polyplex Trading Co. Ltd. China).
Polyplex Corporation Ltd, which is the holding company, had 70% stake (directly and/or through investment companies) in Polyplex (Thailand)
Public Company, (PTL). PTL is the most important subsidiary of Polyplex Corporation as it has (directly and/or through investment companies) 100% stake in Polyplex Europa, 100% in the distribution company in China and 80% stake in the distribution company in the US. Below is
the holdco opco structure.

Source: Polyplex Corporation Ltd.’s annual report
The holding company, Polyplex Corporation Ltd, in November 2010 and in March 2011, sold approx. 11% and 8% stake in PTL, for approx. Rupees 6.37bn. With these sales, the consolidated holding of Polyplex Group in PTL decreased from 70% to 51.0%. The value of this 51% stake in PTL as per the above sale price = (Rupees 6.37bn *51%) / 19% = Rupees 17.1bn.
This should be the buying price or the market value of the remaining 51% holdings of subsidiaries, as per the recent transaction. Adding tangible book value of the standalone company to it, we get Rupees 17.1bn + 3.18bn = Rupees 20.28bn. So this can be considered as the total market value of the holding company (Polyplex Corp), as per recent market transactions. This market value divided by no of shares outstanding gives a share price of Rupees 634.07 (202,775 / 319.80 = 634.07), the stock is trading at 193.5, a clear upside of 228%.

A Rupee 7 yearly dividend, which the company has recommended on 30 May 2011, makes it even better. That said, you can get stuck in the value trap for a long time. Consider this as a long term play. In short run the stock can go further down due to margin pressures. The upside is anywhere between 50% to 200% in 1 to 4 years.
Don’t trust ANYONE’s analysis, do your own. Buy good companies at low valuations.
Notes:
1) Consolidated Financial Results include the results of the following subsidiaries – Polyplex (Asia) Pte Ltd. (PAPL), Polyplex (Thailand) Public Company Ltd. (PTL), Polyplex Singapore) Pte Ltd. (PSPL), Polyplex Europa Polyester Film Sanayi Ve Ticaret A. S. (Polyplex Europa), Polyplex (Americas) Inc. (P.A.) and Polyplex Trading (Shenzhen) Company Ltd. (PTSL).
2) All numbers, including but not limited to, EBITDA, etc are adjusted to exclude any one time, non operational and/or non-cash charges and hence may not match as reported by the company.
3) It is very important to read the disclosure and disclaimer before making any investments based on the above article.
Disclosure: Long Polyplex Corporation Ltd. (Code:POLYPLEX, in National Stock Exchange of India a.k.a. NSE )
Disclaimer: It is very important to read the disclaimer before making any investments based on the above article.
-Suneet Chandvani
The case for Goldman: why Goldman is undervalued
Goldman v.s. SEC: Goldman Sachs (GS) was accused of securities fraud in a civil lawsuit filed on 16 April 2010, by the SEC. As per the SEC, Goldman created and sold a mortgage investment that was intended to fail. As per the SEC, Goldman told the investors, to whom it sold the securities, that the bonds (underlying asset) for the Abacus 2007-AC1 CDO would be chosen by an independent manager. However, Goldman, in Feb 2007, let Paulson and Co. select mortgage bonds. Paulson and Co. selected those bonds which they believed were most likely to lose value (so far not proven). Later Paulson and Co. placed bets against Abacus 2007-AC1 CDO. During the housing debacle, the Abacus 2007-AC1 CDO lost a significant amount of its value and Paulson and Co. made money as the firm had placed bets against the CDO. This is just like Mr. X choosing your cards in a game of Black jack and then Mr. X placing a bet with Mr. Y (a totally different entity) saying that you will lose. Obviously you have high chances of loosing as Mr. X has given you a 3 and a 4 in a game of Blackjack. At least that’s how I see it. I agree, it wasn’t so obvious that the housing market would collapse in early 2007, when the investments were sold. That said, since Paulson and Co. had picked the underlying securities (if that’s the case) and betted against the CDO, probably they knew that the chances of that CDO loosing value was high. It is all about chances in the market, nothing is 100%.
Criminal Investigation: on 29 April, Justice Department opened a criminal investigation of GS in connection with its trading activities. Federal prosecutors in New York are investigating the matter to determine whether to pursue a criminal fraud case. It seems likely that this was initiated on a referral by the SEC, which the SEC had indicated was a possibility when it filed its civil lawsuit. History shows that most such probes end up with no charges. Also, GS has ongoing cases with the ENRON litigation since 2001. The cases may go on for years, if not settled, and the stock price goes back to normal.
Here are a few reasons why I think GS’s stock is undervalued and has a decent upside.
i) Locking testimony of the key employees: Goldman made a smart move by locking in testimony of the key employees involved in the litigation process. Tourre’s public statements make it less likely that he could change his statement later for a lesser penalty with the SEC in return for information that could be detrimental to Goldman Sachs.
ii) Reputational Risk: People talk about reputational risk. Most of GS’s revenues is derived from its trading business (72% of total revenues in 1Q10 and 60% on avg for last 2 years), which is immune to reputational risk. I mean, reputation is important in Investment Banking (IB) business but GS’s IB business, on average for last 2 years, has been contributing 14% to their total revenues. Their IB business was just 10% of their total revenues in 1Q10. Even if GS losses 20% of its IB business due to a negative impact on their reputation, it would hardly effect their bottom line and their EPS. Just to give you a gauge, if this quarter’s (1Q10) IB revenues declined by 20% their quarterly EPS would have declined by a meager 0.4 per share, from the present 5.59 to 5.19. Multiple that by 4 and we get a yearly decline in EPS of 1.59 from its present TTM EPS of 23.96. source: GS analysis
iii) Worst case scenario: According to Brad Hintz, an analyst at Sanford C. Bernstein & Co. , the “worst-case liability” for GS if the SEC succeeds would be USD 706.5m hit to net income, or USD 1.2 in their EPS. That is a small figure as compared to their present TTM EPS (as of qtr ending 31 March 2010) of 23.96. Also, GS had USD 38.3bn cash and cash equivalents as of 31 Dec 2009. An outflow of USD 706.5m wouldn’t have a significant impact their balance sheet.(source: http://www.bloomberg.com/apps/news?pid=20601087&sid=aLeACVxGpmT4)
iv) Adding reputational risk and the “worst case scenario”: Adding the decline in EPS from both the above scenarios (1.59 + 1.2 = 2.79) and deducting that from the current TTM EPS of 23.96 (23.96 – 2.79 = 21.18) we get 21.18. Dividing that by current stock price of USD 145.2 (as of 30 April 2010), we get a P/E of 6.85, very close to 6.7, GS’s 5-year avg. of low P/E’s. So even in its worst case scenarios GS’s stock is pretty much at its lowest and is definitely not a bad deal.(source: GS analysis)
v) Sovereign Debt Issues: In case markets crash due to sovereign debt issues in EU, GS will make money as their bets will go right. Also, more volatility is usually good for traders. This will boost their trading revenues, which is, on average, 60% of their total revenues.
vi) Markets overreaction: Market always overreacts and the price of GS has gone down significantly as compared to its fundamentals. Once the situation is back to normal, GS’s stock should shoot up and cover the gains it lost after SEC filed a case against them. Even though Bank of America and S&P analysts have downgraded GS to sell, I think there is a huge upside to the stock and a limited downside. If one wants to really take risky bets on GS they can invest in GS Jan 2011 call options (aka leaps). This position will give a lot of time for the stock to recover and the returns can be tremendous. Obviously there is a lot of volatility in the stock and option price is driven by volatility.
Disclaimer: Please read the Disclaimer.
-Suneet Chandvani
