10thquantum
S&P
The Fake New Normal
Everything is great, keep the party going!
Europe: European problems are far from over. It is sinking in deeper recession with unemployment in 17 country Euro-zone at historically high levels of 12.1% and increasing. Retail sales dropped 0.1% in March from a 0.3% slide the previous month. Unemployment in Spain is now up 27.2% and mortgage delinquencies are continually rising. Portugal is moving toward a second bailout. Its government is considering to pay public workers in Treasury bills instead of cash. It also plans to slash 30,000 public sector jobs as a part of spending cuts. France’s business survey shows that it could enter recession (see chart below). Germany is faltering too with car sales in March down 12% y-o-y. While Slovenia’s creditworthiness is deteriorating as investors speculate a banking crisis in the region (see charts below). Banks in Slovenia are significantly undercapitalised with toxic loans now standing at 18% of GDP. All that said, Spain’s 10-year yield dropped to 3.8% for the first time since October 2010, yields on two-year Italian notes fell below 1% for the first time on record and 10 year Portugal bond yields dropped to 5.5.%, least since October 2010. This was after the ECB cut its main refinancing rate on 2 May and signaled it was open to a negative deposit rate. Conclusion: deteriorating fundamentals but significantly lower yields. Welcome to Matrix!

source: zerohedge

source: zerohedge
The US: It is not just Europe, the US macro economic data hasn’t been strong as well. 1Q13 GDP missed expectations and came in at 2.5%. Excluding inventory it would be at 1.6%, a very anemic growth. The total of ISM manufacturing and non-manufacturing index declined by 4.1% and 1.8%, sequentially, in March and April 2013. Construction spending tumbled 1.7% in April to a seven month low. Housing market index for the month of April was down. Thomson/Reuters Small Business Lending Index showed small businesses reduced their borrowing for a fourth month in a row and delinquencies on outstanding loan balances rose for the first time in more than three years. The ADP employment report indicated that the US economy added just 119,000 private-sector jobs in April, which was below consensus expectations of 155,000. People employed as a % of total civilian population (the real gauge of employment) in April was at 58.6%, pretty much same as in 2012 and just a little improvement from its historical low of 58.2% in July 2011. Most of the US macro economic data hasn’t met expectations but the market has ignored all of that and has only gone in one direction: north. Below is the chart showing the disconnect between economic data expectations (Bloomberg Economic Surprise Index) and S&P.

Source: zerohedge

Consumer Spending Fundamentals: Y-o-y growth in personal income has also been very anemic and below inflation, with y-t-d 2013 monthly average of 2.5%. Savings as a % of personal disposable income is currently at 2.7%, below 3% is a warning signal. With low income growth and already low savings rate, consumer spending, the engine of the US economy, doesn’t have a lot of room to run. Above all, q-o-q percentage change of personal income excluding current transfers is at recession levels (see chart 3 below). Also, the effect of tax increases (payroll and other taxes) comes at a lag and might be seen in the coming quarters. Lastly, people have forgotten about sequestration as if it never happened. Its impact has yet to begin.

 Source: zerohedge

Source: zerohedge
Sales growth and Margin expansion: Macro US data and Europe doesn’t matter, ultimately what matters are earnings and companies are beating expectations. Europe has been this way for a long time and market has understood to ignore it. Earnings is what market cares and companies have been beating expectations.
This is what the bulls argue. It is true, however companies have been beating only bottom-line by low-balling expectations. They have been missing on top-line. Sales growth is declining as the base is already high and the economy is growing at a slow pace. Sales growth is down from 9% levels in 2011 due to a very low base in 2010, to just 4% levels in 2012. So far in 1Q13, more than 50% of the S&P companies have reported earnings with more than 57% missing revenue estimates.
Also, corporate margins are at historic highs. Margins are mean-reverting and cannot keep going higher. S&P operating margins peaked at 9.5% (highest in last 13 year) in June 2012 and were at 8.0% in December 2012. The US corporates are the leanest historically and there is not much to squeeze to increase margins. Also, a lot of debt has been refinanced at super low rates reducing the interest cost which is one of the reasons for high margins. Conclusion: slowing sales growth and not enough left to squeeze to increase margins doesn’t sound like a good profitability recipe.

Source: zerohedge

Source: zerohedge
Current market P/E: market probably not that cheap: But markets are cheap, so all the above doesn’t matter as long we can buy good quality stocks for cheap.
Nothing is cheap in this market. March ending ttm earnings expectation for S&P are: as reported earnings: 88.06 (y-o-y inc of -0.5%), operating earnings: 98.78 (y-o-y inc of 0.7%). At these levels we have
Price to sales: 3 May 2013: 1.48; 31 Dec 2007: 1.43
PE (as reported earnings): 3 May 2013: 18.33; 31 Dec 2007: 17.36 (historical long term average is approximately 15.5x)
Price to book: 3 May 2013: 2.42; 31 Dec 2007: 2.77
All these ratios are above historical averages and equivalent to 2007 peak showing that the market is overvalued.
Flaw in S&P earnings estimate calculation: It doesn’t matter, future earnings expectations are high. Also, on a forward basis (FY13) market is cheap, trading at only 15x PE (reported earnings).
For FY13, analysts are expecting, as per S&P (as of 29 April 2013), a 14.2% increase in operating earnings to USD 110.5 and a 24.3% increase in as reported earnings to USD 107.6 (see graph below) (historical long-term earnings cagr is 4.8%). Considering the high sales base and end of productivity gains, I think, this is an optimistic view which makes S&P vulnerable. However, the main catch is how these forward earnings are calculated. This article on Seeking Alpha beautifully describes the mismatch between actual and expected earnings. The main difference is the pension expense. The crux being actual operating earnings are calculated by a different analyst which includes pension expense as a normal expenditure while estimates are calculated by another group of analysts which excludes pension expense while calculating operating earnings, as they consider pension expense an “unusual item”. This makes the expected earnings look inflated. So if the market is trading at high valuations (S&P already up 10.5% YTD, in just 4 months) based on expected earnings which are already inflated and the economic data is getting worse, probably it may not be a pretty scene. Conclusion: investing when it looks the easiest is at its hardest.

All the other asset classes and markets: While S&P keeps going in a straight line at 45 degrees, MSCI emerging market index is down, Europe is down, CRM commodity index is down, copper and steel has had a significant move down, personal income growth in the US is below inflation and banks are planning more job cuts. The market is conveniently ignoring all that. Apart from foreign risks (Europe’s debt crisis, Japan’s reflationary commitment, etc), the current overvalued market has a risk of rising interest rates, stopping of quantitative easing, reversing of historically high margins and probability of missing high earnings expectations.

source: zerohedge
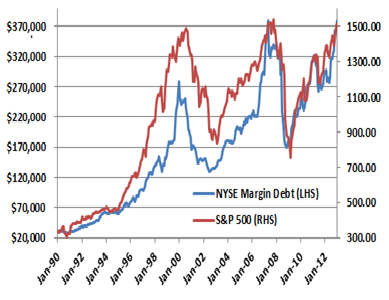
Who is buying?: Recent article by WSJ, Bond Funds Running Low on…Bonds, points out that the number of bond funds owning stocks is at its highest point in 18 years, showing that if bonds are in a bubble, equity is a place to go, even if that’s not their expertise. A sign that typically conservative investors are taking bigger risks to boost returns via dividend paying stocks. A clear consequence of money printing and significantly low interest rates, not benefiting masses at large instead making markets vulnerable. The other class of buyers is traders as no one wants to miss the rally. This has resulted in equity crowded trade. The below graph shows NYSE margin debt, which is at its all time high. Last two highs were in 2000 and 2007, when market peaked. If market falls, margin calls would be all over and the drop could be precipitous.
Japan: Who else is buying? The Japanese? The historically biggest Japanese quantitative easing is resulting in flight to safety from Japanese investors, who sense that their own bond market is on the verge of breaking down. This has managed to send French and Belgian bonds to record lows, the Spanish 2 Year to sub 2%, the German 6 month bill negative in the primary market, the US 10 year below 1.8% and 30 year sub 3%. Also, the yield-hungry-safety-looking Japanese are buying the US equities contributing to overvaluation and the fundamental disconnect. The immediate result is that the bond-equity disengage continues to diverge. Is this a new normal? If yes, it is not healthy and can’t go on for a long time.
FED support: Lets, for a minute, assumes how the economy would look if FED support is taken off. Excess liquidity goes away, interest rates rise and stocks fall. So the economy is still on FED crutches and an overvaluation in such a scenario only shows irrational exuberance. Assuming that the consequence of money printing is just positive is naïve. Also, assuming that a slow withdrawal of money printing would be smooth and easy is an irrational thought. No one has been able to do it, the Germans, the Japanese, the Argentinians etc have all failed. We have seen countries stuck in the liquidity trap and unable to exit but never there is an instance when a country exited smoothly without any pain. The question now is that if 5 years of massive QEs cannot revive the economy, what can? Also, if the market falls, people will start doubting the effectiveness of QE.
The incomplete cycle: Lastly market operates in cycles. A common saying is that get your companies right and don’t worry about Mr. Market. He will have mood swings but eventually you will be rewarded for picking up the right companies. They forgot to mention the price. Price is everything. Equity market can be dead for more than a decade and make you extremely rich in another decade. The concept of market cycles has been proved historically era after era. Below table shows 16 year market cycles from 1886 until present. The current cycle looks incomplete with a positive return instead of a negative cagr.
 Most people fail to recognize that absence of immediate crisis doesn’t mean that we won’t eventually face one and that the consequence of money printing isn’t just positive. In a global central bank money printing environment where economic fundamentals don’t matter, VIX at a complacently low level of below 13, major continents in recession and earnings based on overly optimistic future expectations, I guess one should think twice before investing. What we know for certain is that during the most recent market cycle, the repeated hope that stocks could detach from the economic data proved to be unfounded in nearly every instance: 2010s fall in May and June, 2011s fall in August and September and 2012s fall in May and June. When debt to central bankers or economists doesn’t matter: debt growing from USD 6 trillion to USD 16 trillion in past 12 years, it is time to take a step back and think.
Disclosure: long S&P put spreads
Disclaimer: It is very important to read the disclaimer before making any investments based on the above article.
Understanding the economy and its relation to the stock market
This is one of my many attempts to understand the economy and how that relates to markets. The U.S. economy’s health could serve as a leading indicator and an understanding of it could help in hedging your portfolio. 70% of the U.S. economy is consumer spending. As long we can understand the consumer, their spending pattern and the likelihood of a cutback or a potential shock, we can get some idea of potential economical problems. The model is simple, very logical but still powerful. It tracks the health of the economy by analyzing three factors:
i) monthly savings rate of the U.S. population (the higher the savings rate, the better the cushion; the lower the savings rate, the more the people are susceptible to a default).
ii) growth in interest payments of the U.S. population (significant increases in monthly interest payments would mean the consumer is vulnerable to a default).
iii) growth in personal income of the U.S. population (significant increases in personal income of the population is not sustainable; eventually companies have to become efficient. If for any reason the economy turns and companies have to downsize the immediate impact could be significant).
By back testing these three metrics on S&P I found some very strong results. If the score of:
average growth in interest payments for last 12 months
+ average growth in personal income for last 12 months
– average of last 12 months of savings rate*2
= more than 13%, market could be prone to a very significant crash.
When applied, the model predicted the falls quite accurately. The score 13% was hit just 4 times since 1959 (since we have data).
i. in November 1980 (S&P fell by approximately 15% in 10 months),
ii. in September 2000 (S&P declined by 27% in 12months),
iii. in September 2005 when it didn’t exactly work and S&P kept increasing
iv. and last in June 2007 (S&P declined by 50% in 20 months).
The model gave a score of 13 in September 2005 but it did not work. In a way it worked (indirectly) as it built up and then the decline was extreme. The model serves as a warning but isn’t exact. Also, these indicators work well in a low savings rate environment but fail to function in a high savings environment (that’s the reason savings is given more weight and is multiplied by 2). This makes sense, as the savings rate was high in 70’s and 80’s in the U.S. and even with the increase in loan growth and interest rates, the market didn’t crash significantly. We only saw some modest recessions due to external events but not due to the fundamental health of the economy. Also, savings rate in the emerging markets is high (India: 25%-30%, China: 35%-40%) which gives a cushion in these markets and hence we haven’t see significant decline in asset prices there.

Though the market (S&P) has run up too fast, the score has indicated a strong recovery. We might see some correction due to the fiscal cliff, which, if implemented, could have serious consequences on economic growth. However, the U.S. consumer has de-levered radically and is now slowly levering up. The deleveraging part of the score (average growth in interest payments for last 12 months) has been negative for 45 months between October 2008 and June 2012. Only recently, in the month of July 2012, it turned positive. Personal interest payments have gone from their peak of USD 274bn in the month of September 2007 to USD 182bn as of September 2012 (latest month), a reduction of 34%. Overall score stands at -1.8% as of September 2012 and is way below the vulnerable point of 13%. I think there is a lot of room for the market to expand. If in the short term there are corrections for any reason, that would be an opportunity to buy for the longer term. Eventually the animal spirits will kick in and technological innovations will create boom. There are a lot of technological innovations happening which will not only create jobs but will increase consumer spending. As Sir John Templeton said, bull markets are born on pessimism, grow on skepticism, mature on optimism and die on euphoria. I think we are somewhere in the pessimism and skepticism stage and in the long run we have a lot of room to grow. The model helps serve as a leading indicator.
Disclaimer: It is very important to read the disclaimer before making any investments based on the above article.
